

Let's talk executable files. This is a very broad topic as there are several types of executable files. The definition of "Executable Files" basically boils down to a file that tells a computer to preform a series of actions. These types of files are typically machine code, byte code, or somehow encoded for machine use. Each machine type executes some executables differently depending on various factors.
According to Wikipedia - "An executable or binary, causes a computer "to perform indicated tasks according to encoded instructions",[1] as opposed to a data file that must be interpreted (parsed) by a program to be meaningful."
Further Definition
The format of an executable depends mainly on the system ABI. Think of the ABI as a bridge between the program being executed and the kernel / OS API. I'm not gonna bore you with the deep details of how OSes work, but instead will keep this part of the post at a high level discussion. A point of clarity, notice I haven't said "program". This is to avoid confusion. Some people consider scripts as programs. Python "programs" themselves are not actually executable, they are interpreted by the Python program and executed by the Python program. This get's most people into a debate on what a program is. Is a Bash script a program? Is C++ source code a program? You can see where I'm going here, and where things get sticky, so we are just going to side step this part of the debate and focus on "executable files" and not semantics of what makes up programs.
Code Types
Now that we know what an executable is, and what it's not, let's talk about how they are made. Typically we programmers type "source code" which is then compiled into machine code or byte code to be executed. Sometimes this is called "high level code" vs "low level code". Examples of High Level coding languages are Java, Python, C++, Go, Rust etc. Some examples of Lower Level coding languages are C, ASM / Assembly, Cobal, RPG etc.

"How does a machine know if a file is an executable or not?" you might be asking. This comes down to the formats and headers of a file. Here is a link to a very large table of all the executable formats. This post would be way too long if we were to deep dive into them all. For today's examples, we will be studying mainly ELF files. ELF files are mainly used in the Linux world, but have been used in things like the Nintendo Wii, Android, Power PC etc.
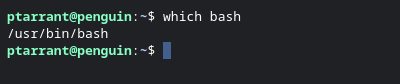
Enough talking, let's start looking at some files to see what they do. For this first example, let's look at Bash. We need to find the location of Bash. To do that, let's run the "which" command on Linux to find Bash.
Let's take a deeper look at Bash by running the File utility. The File utility reads the headers of a file and leverages magic bytes. What are "Magic Bytes" you ask? Basically it's the first set of bits in a file (the header) that tells the computer what type of file this is. Some call them file headers or file signatures as well. You might also hear them called MimeType. Let's look at bash again, but this time with the File utility.
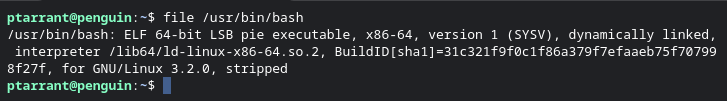
So, looking at the above information we get a lot of info about /usr/bin/bash. First, we see it's a 64 bit ELF executable. We also see it's dynamically linked (more on this later). and you see the interpreter location, as well as the Build ID. Let's look a little closer at this file. Let's look at a snippet of the file in Hex. I ran wc -l in this example to show you that the file /usr/bin/bash is over 6000 lines long. We are only going to be looking at the beginning of the file by piping the Hex dump to head and only the top 30 lines
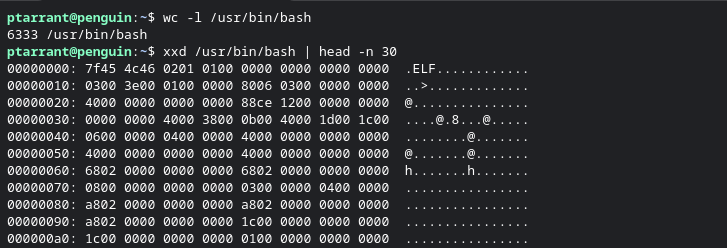
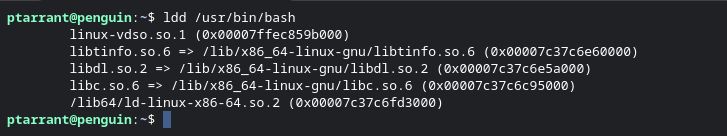
Right there at the start you can see this is an "ELF" file. Other file types use different headers. An example is PE files which start with "MZ" headers. Pretty much every file type has a signature. So we know the type of file, but looking back at our previous "File" command output, it says it's a dynamically linked file. This is because Bash relies on other files to run. In windows these are commonly "DLL" files. DLL stands for Dynamically Link Libraries. Getting back to Linux, let's examine what library files it uses when running. We can do this using the ldd utility. Look at the screenshot below.
What we know so far
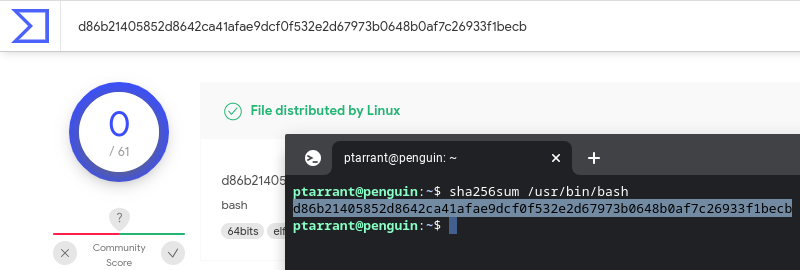
So now we know that bash is an ELF file, and it leverages 5 other files to run. We also have examined the first part of the file using xxd and head to trim the output. That's great! We have a ton of ideas about this file already with just a few commands. Let's take it a step further now. Let's create a hash of this file. File hashes are used to identify files often. We can search file hashes in several places, and Virus Total is a great resource if you think a file is possibly malicious. Let's make a hash of /usr/bin/bash with the sha256sum utility. As you can see below, I've created a hash and looked it up at Virus Total. You can see the results here. You can also use md5sum or sha1sum to generate the other hashes.
Further Examination
Now we know this version of Bash isn't evil, let's dig even further. If you are following along in your own VM or on your own machine, you will need to install 2 programs. Strace and Ltrace. On Debian / Ubuntu these are installed by sudo apt install -y strace ltrace. Once those are installed, we can now do a library trace of a program and output the data to a file. Since Bash is interactive, and won't close until you tell it, let's pick another program. I'm going to use tar for these commands.
Ltrace
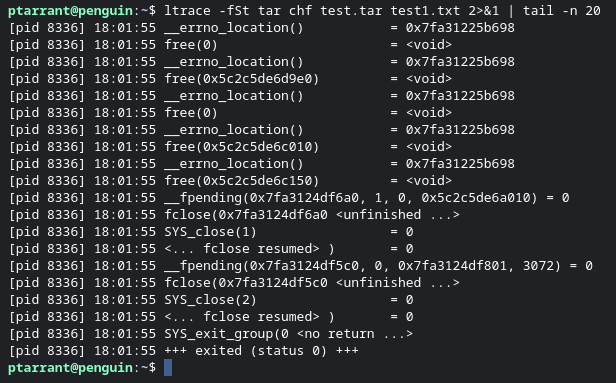
So, a word of caution here. Ltrace produces a ton of output. It traces and reports on EVERY library call. This is different from ldd from earlier. Ltrace shows you every call to those library files we saw in ldd. It produces so much output, I am going to trim it to only a few lines with tail in the command below to give you an idea of the output you would see. Unless you are doing malware analysis, this won't be much help to you however, it's a little peek into the life of a Cyber Engineer who does malware analysis. Here is am running ltrace on the tar utility. As you can see, the PID is reported as well as raw memory addresses into files. You will also see 'free' commands used to clear memory. It's very detailed.
Strace
Where ltrace looks at libraries called, Strace is used more for system calls. These are calls directly to the kernel. Let's use strace to take a peek into ping and what all goes on when you run it.
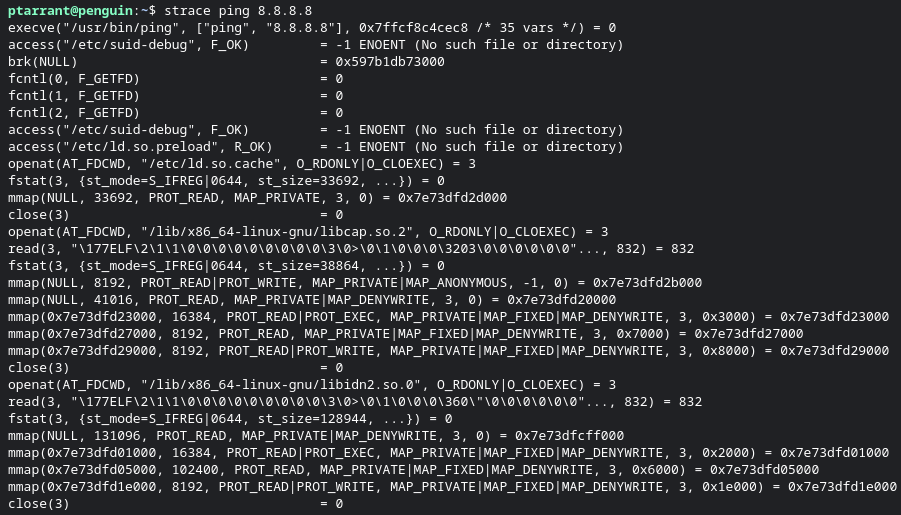
Wow, that's a lot going on isn't it? here you can see each access call, each execution of a file, each mmap (used for virtual memory mapping) and opening of other files such as linked libraries. This is only part of the output. Let's summarize the calls made by this program to get an overview not only of the calls made, but how much time was used on each call during execution of the program.
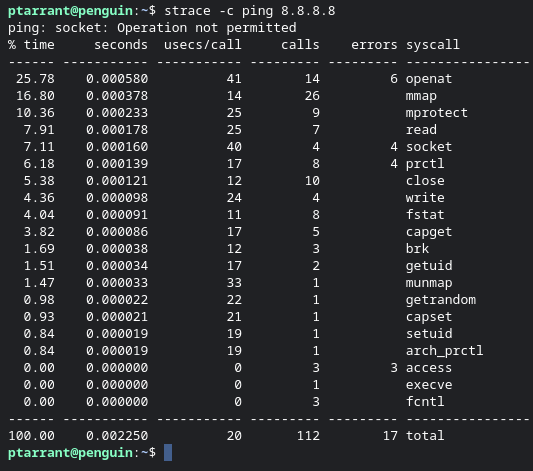
strace -c will add a summary and count table for you to review.As you can see, we made 112 sys calls across the sys call endpoints. We can also see that Strace gives us the percent of CPU was spent on each sys call, and we spent 25.78% on open at (opening other files). All of this was done in .00225 seconds. That's fast! If you are a programmer, this is a great utility to see what takes longest in your programs. If you are hunting malware, this gives you a good overview of what is happening.
But wait there's more!
There can't possibly be more though right? Well, yes, there is more. Let's dig into the last command we will cover in this post. lsof is a utility that stands for "List of Open Files". This program will show you a list of every file touched by a program and is a great way to monitor what a program is doing, or the entire system overall. Let's dig into a program I have running now - dhclient. First I will use ps aux to list all processes, then pipe that to Grep to find the dhclient PID ID. Then once we have the PID, we can run lsof -p to see all the things it's touching.
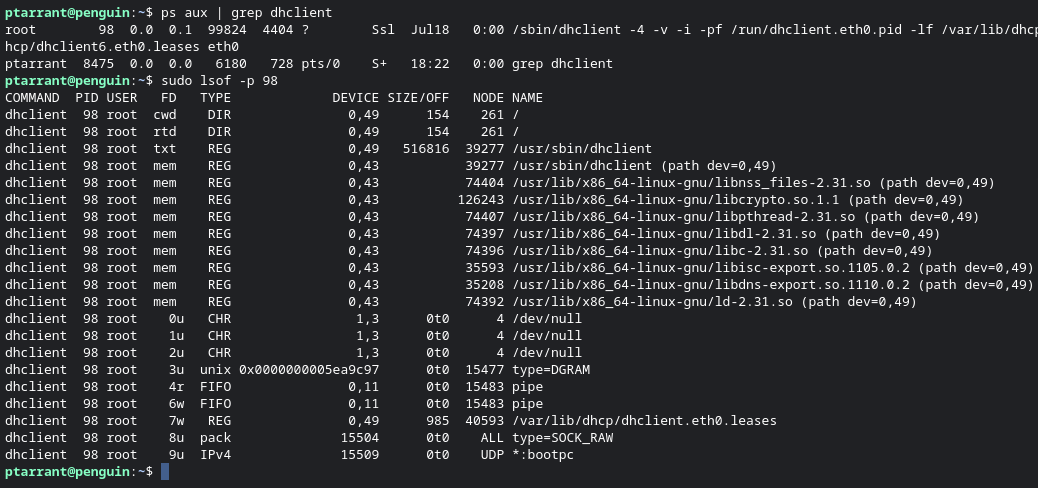
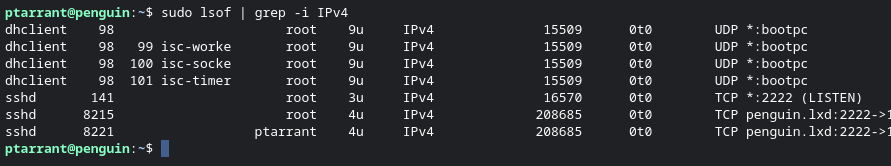
Here you can see the cwd (current working dir) of the program, the pipes, the libraries called, even the IPv4 call for UDP. You can also see the FIFO (first in, first out) pipe "files". Again, if a programmer or malware hunting, this type of information is vital. Think about a program calling out to a random IP, this is how you find it easily without having to spend hours looking at firewall logs. Side note, you can also just run lsof to see every file open on the system entirely, and grep that to look for IPv4 to see all network activity. Here is an example:
Note that not all executables use dynamic libraries. An example of these are binaries written in "Go Lang". You might notice people talking about Go and say things like "static binaries", and "memory safe". This is because in Go, your libraries are built into the binary themselves, no reliance on external libraries, and as such utilities such as ldd will be lack luster for you, however the other stuff will still work.
This concludes our deep dive into ELF files. I might do a part 2 to this article and explain all the cool things you can find in /proc inside Linux. Later we will be doing an article on memory forensics which will be just as technical and complete as this article so stay tuned for that.


Discussion