

Let's start with some straight talk. You don't really need fancy monitoring tools like Grafana, but I have to admit, they do have their own charm. Grafana isn't just about looking good, it's a pretty amazing tool that lets you customize how you see your system data.
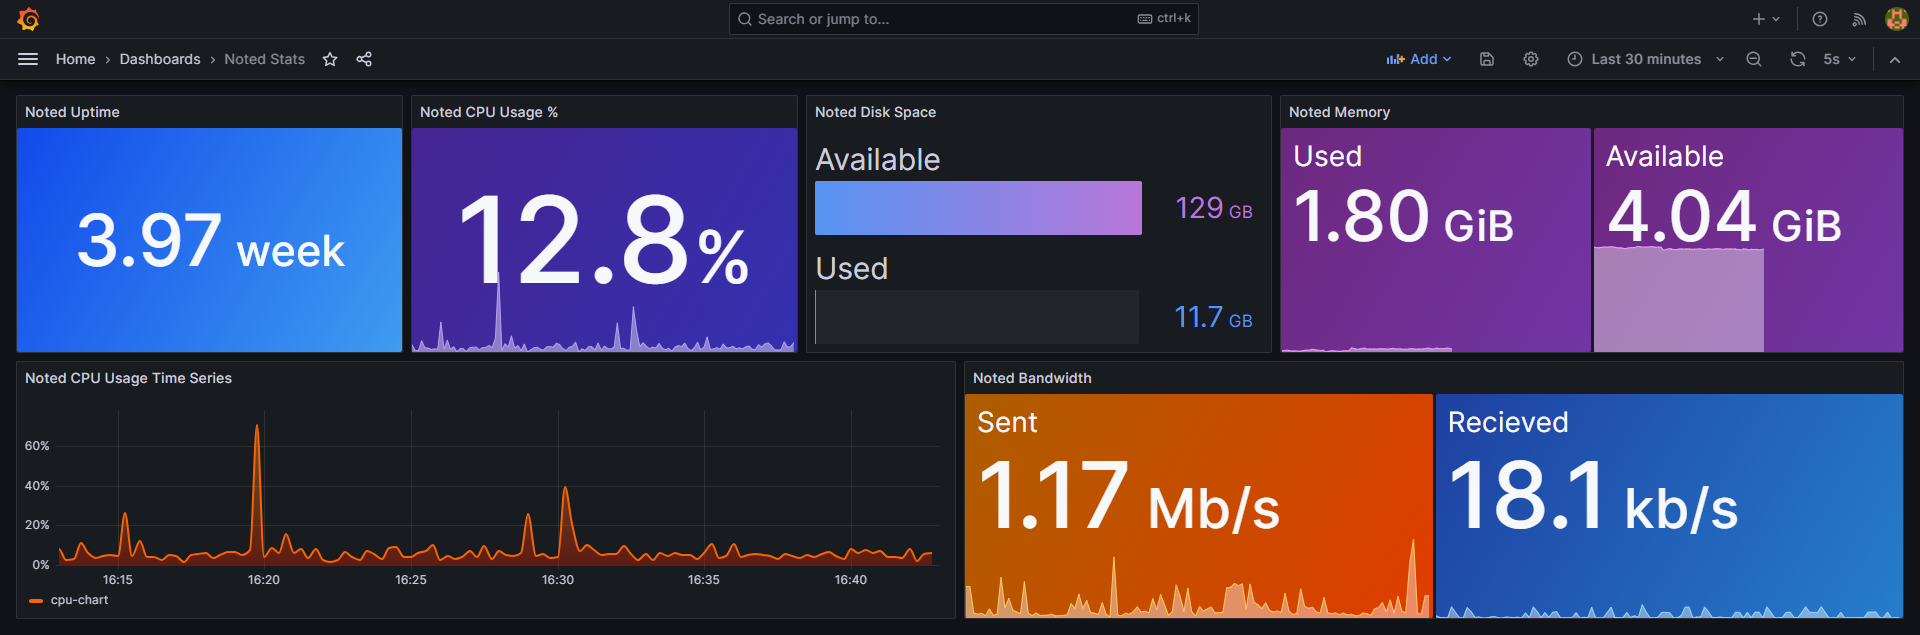
In this step by step guide, we're going to create a straightforward yet effective system monitoring dashboard. To achieve this, we'll be utilizing the powerful trio of Netdata, Prometheus, and Grafana. By the time we're done, you'll have a visual representation of your system's key metrics that resembles a professional monitoring setup, complete with charts and graphs for comprehensive insights into your system's performance. Here's a preview of what the final product will resemble.
I want to simplify things as much as possible, so I've created this straightforward flowchart style diagram. It provides a visual guide on how these applications collaborate seamlessly.

Let's begin by getting these three tools up and running on a Linux Debian based system or systems. I'll use Docker to set up Prometheus and Grafana on a virtual machine (VM) using Proxmox. Now, don't stress it, if you've got only one machine, you can definitely install everything on that one. But in my case, where I'm monitoring multiple machines, it's simpler for me to keep Prometheus and Grafana separate from the ones I'm keeping tabs on.
Prepare the machine for the NPG stack
You might have to use sudo before these commands. I'll be logged into the terminal as root, so it won't be needed in my case.
apt updateapt upgradeapt install wgetInstall Netdata on the host machine
The official Netdata kickstart script is compatible with all Linux distributions. Run the kickstart command in your terminal using wget. This will take a couple minutes to complete.
wget -O /tmp/netdata-kickstart.sh https://my-netdata.io/kickstart.sh && sh /tmp/netdata-kickstart.sh --stable-channel --disable-telemetryOnce Netdata finishes installing, you can reach the web interface by entering your host machine's IP address followed by port 19999 into your web browser.
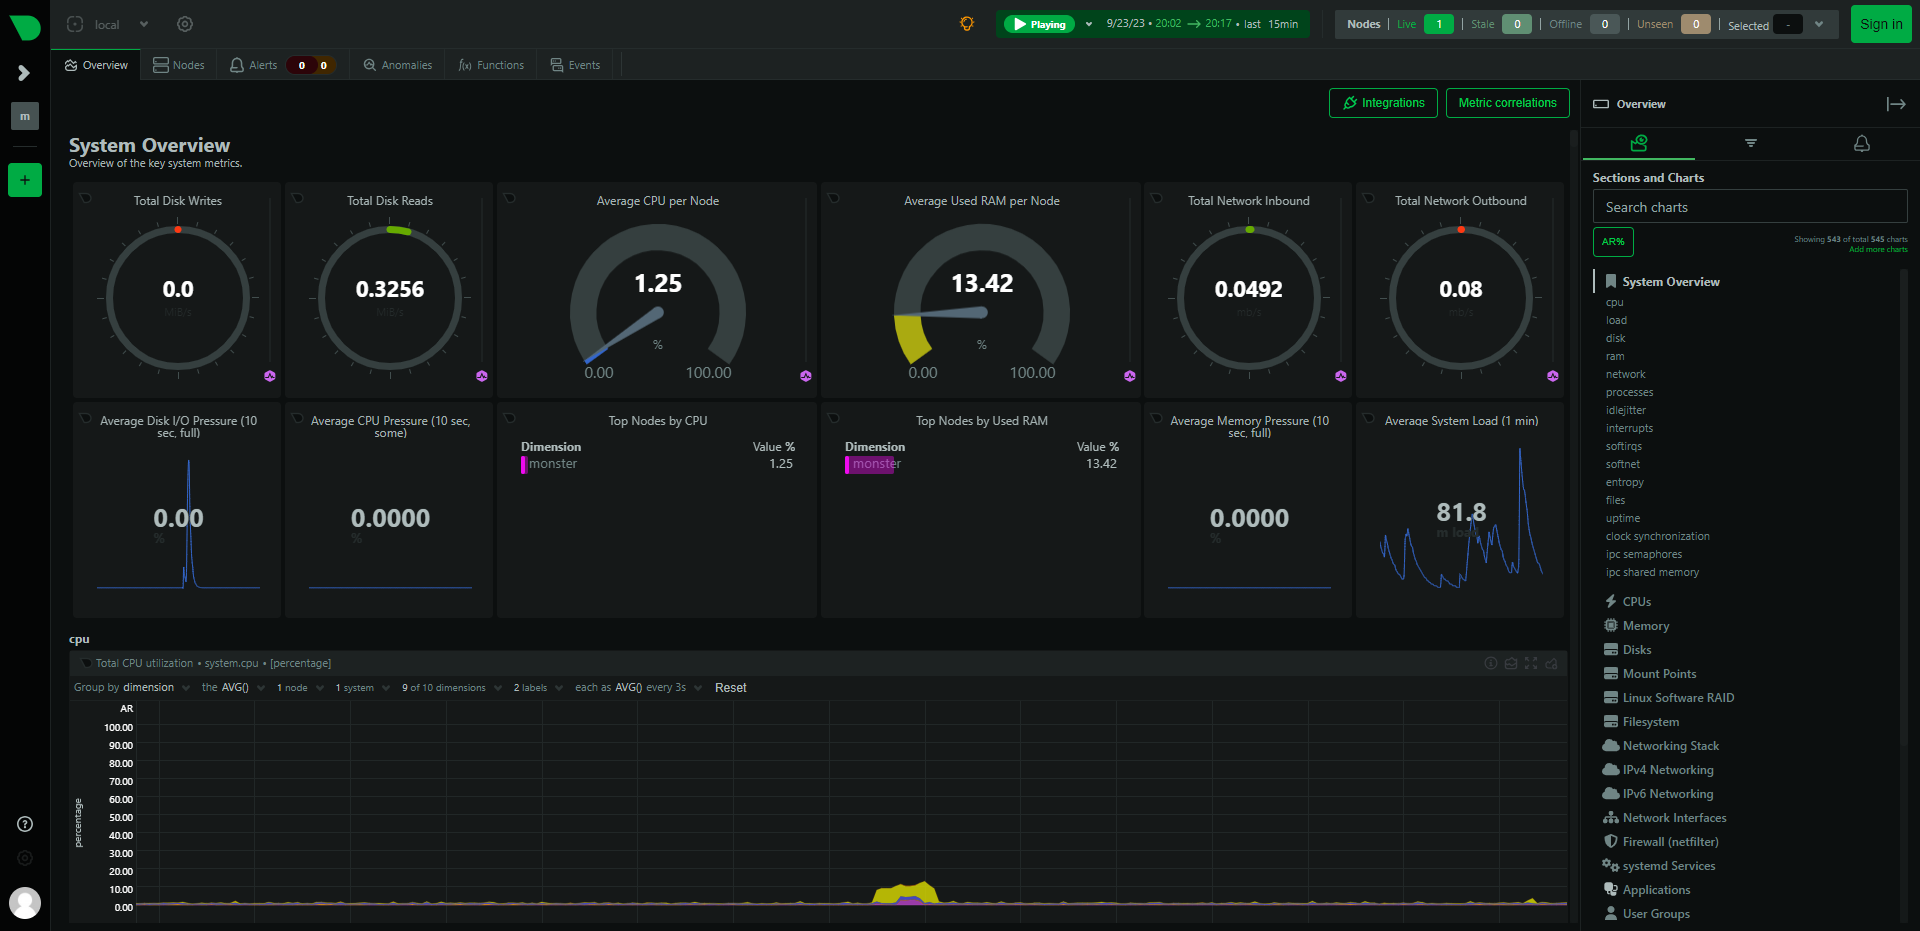
Netdata is the real workhorse here, as it's installed on the systems you want to keep an eye on. While Netdata is a monitoring tool in itself, sifting through all the information it provides can feel a bit overwhelming at first.
Netdata is great for seeing what's happening right now on your system, combining it with Prometheus and Grafana adds some cool benefits. You get to look back in time and see how things have been going, customize how you see your data, and it all works no matter how large or small your homelab is.
apt install lm-sensorsrebootNow that Netdata is installed, we can transmit Netdata statistics to a data collector called Prometheus. Think of Prometheus as the bridge that empowers us to handpick and curate the specific data we wish to showcase through Grafana's visualizations.
Monitor Files and Directories with Netdata
One last thing I like to enable that ships with Netdata is the Files and directories integration. You can use this to monitor directory or even file sizes. But I have multiple shared folders on the same mounted drive and this enables me to see how much space each share is using.
To enable the Files and directories integration:
cd /etc/netdata
sudo ./edit-config go.d/filecheck.conf
Remove all the content inside the filecheck.conf file and replace it with this template.
jobs:
  - name: files_dirs_example
    discovery_every: 30s
    files:
      include:
        - '/path/to/file1'
        - '/path/to/file2'
        - '/path/to/*.log'
    dirs:
      collect_dir_size: no
      include:
        - '/path/to/dir1'
        - '/path/to/dir2'
        - '/path/to/dir3*'

  - name: files_example
    discovery_every: 30s
    files:
      include:
        - '/path/to/file1'
        - '/path/to/file2'
        - '/path/to/*.log'

  - name: dirs_example
    discovery_every: 30s
    dirs:
      collect_dir_size: yes
      include:
        - '/path/to/dir1'
        - '/path/to/dir2'
        - '/path/to/dir3*'
You can remove sections that do not apply to your needs then save the file and restart Netdata.
systemctl restart netdatasystemctl enable netdataMoving forward, we won't be visiting Netdata as frequently, if at all. That's because we'll be sourcing all our data through Prometheus, acting as the intermediary.
Install Prometheus on the host machine
You will need a host machine with Docker and Docker Compose installed for this example. If you need assistance, see our guide Install Docker and Portainer on Debian for Self-Hosting.
Before we install Prometheus we need to create a prometheus.yml file in the /prometheus directory.
mkdir /prometheuscd /prometheusnano prometheus.yml# my global config
global:
scrape_interval: 15s # Set the scrape interval to every 15 seconds. Default is every 1 minute.
evaluation_interval: 15s # Evaluate rules every 15 seconds. The default is every 1 minute.
# scrape_timeout is set to the global default (10s).
# Alertmanager configuration
alerting:
alertmanagers:
- static_configs:
- targets:
# - alertmanager:9093
# Load rules once and periodically evaluate them according to the global 'evaluation_interval'.
rule_files:
# - "first_rules.yml"
# - "second_rules.yml"
# A scrape configuration containing exactly one endpoint to scrape:
# Here it's Prometheus itself.
scrape_configs:
# The job name is added as a label `job=<job_name>` to any timeseries scraped from this config.
- job_name: 'prometheus'
# metrics_path defaults to '/metrics'
# scheme defaults to 'http'.
static_configs:
- targets: ['localhost:9090']
#################################################################################################
- job_name: 'MY-JOB-NAME'
metrics_path: '/api/v1/allmetrics'
params:
# format: prometheus | prometheus_all_hosts
# You can use `prometheus_all_hosts` if you want Prometheus to set the `instance` to your hostname instead of IP
format: [prometheus]
#
# source: as-collected | raw | average | sum | volume
# default is: average
#source: [as-collected]
#
# server name for this prometheus - the default is the client IP
# for Netdata to uniquely identify it
#server: ['prometheus1']
honor_labels: true
static_configs:
- targets: ['MY-IP-ADDRESS:19999']
################################################################################################# There are a couple things you need to change in this file before you save it. Between the hashtags is the job for your system.
MY-JOB-NAME - Choose a brief, descriptive name for this job, often mirroring the name of the server you're monitoring. It helps identify the specific task or system you're tracking.
MY-IP-ADDRESS - Enter the IP address of the machine where Netdata is up and running, the one you intend to monitor. This is the location where Netdata has been installed and will collect data from.
Press CTRL X then Y to save.
Now you can install Prometheus using the following Docker Compose.
version: '3.9'
services:
    prometheus:
        image: prom/prometheus
        volumes:
            - '/prometheus/prometheus.yml:/etc/prometheus/prometheus.yml'
        ports:
            - '9090:9090'
After you've successfully installed Prometheus, simply open your web browser and enter your host machine's IP address followed by port 9090 to access the Prometheus application. There is no authentication for Prometheus. This interface will be your gateway to managing and exploring your monitoring data.
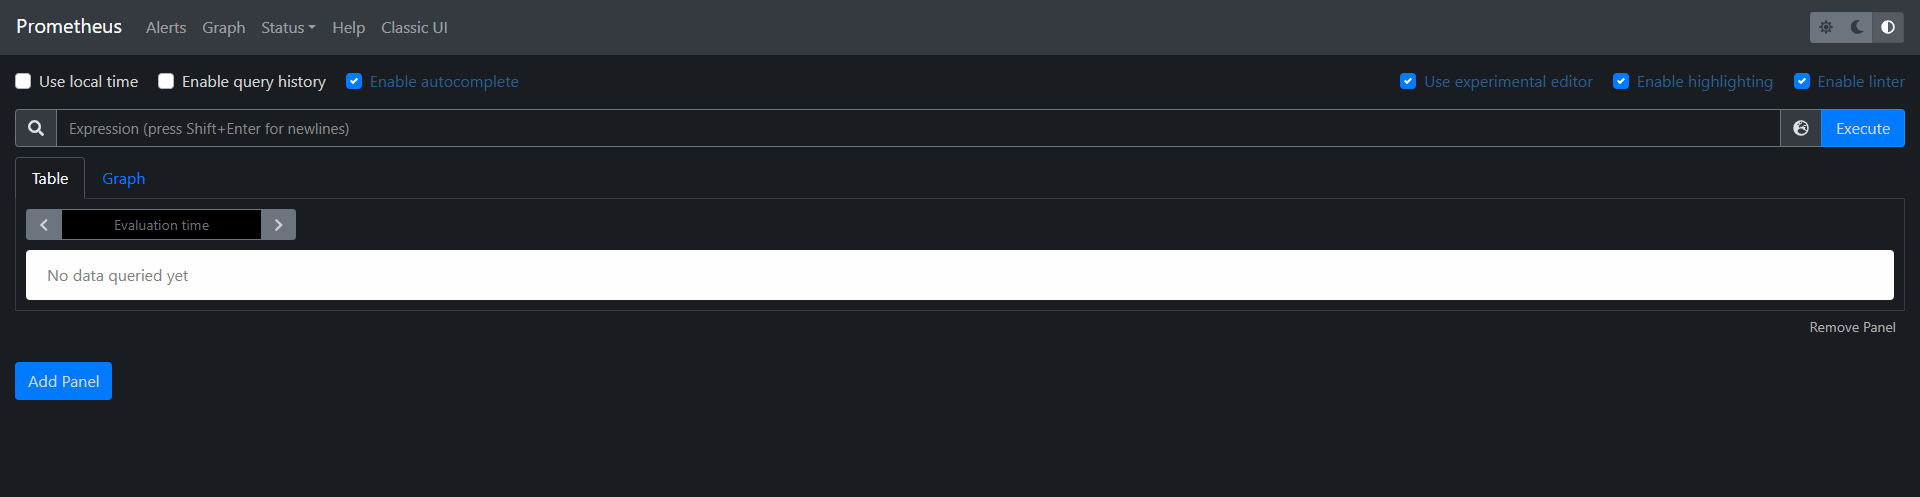
Prometheus plays a role in managing and storing the data that Netdata gathers. Together, they create a powerful monitoring duo.
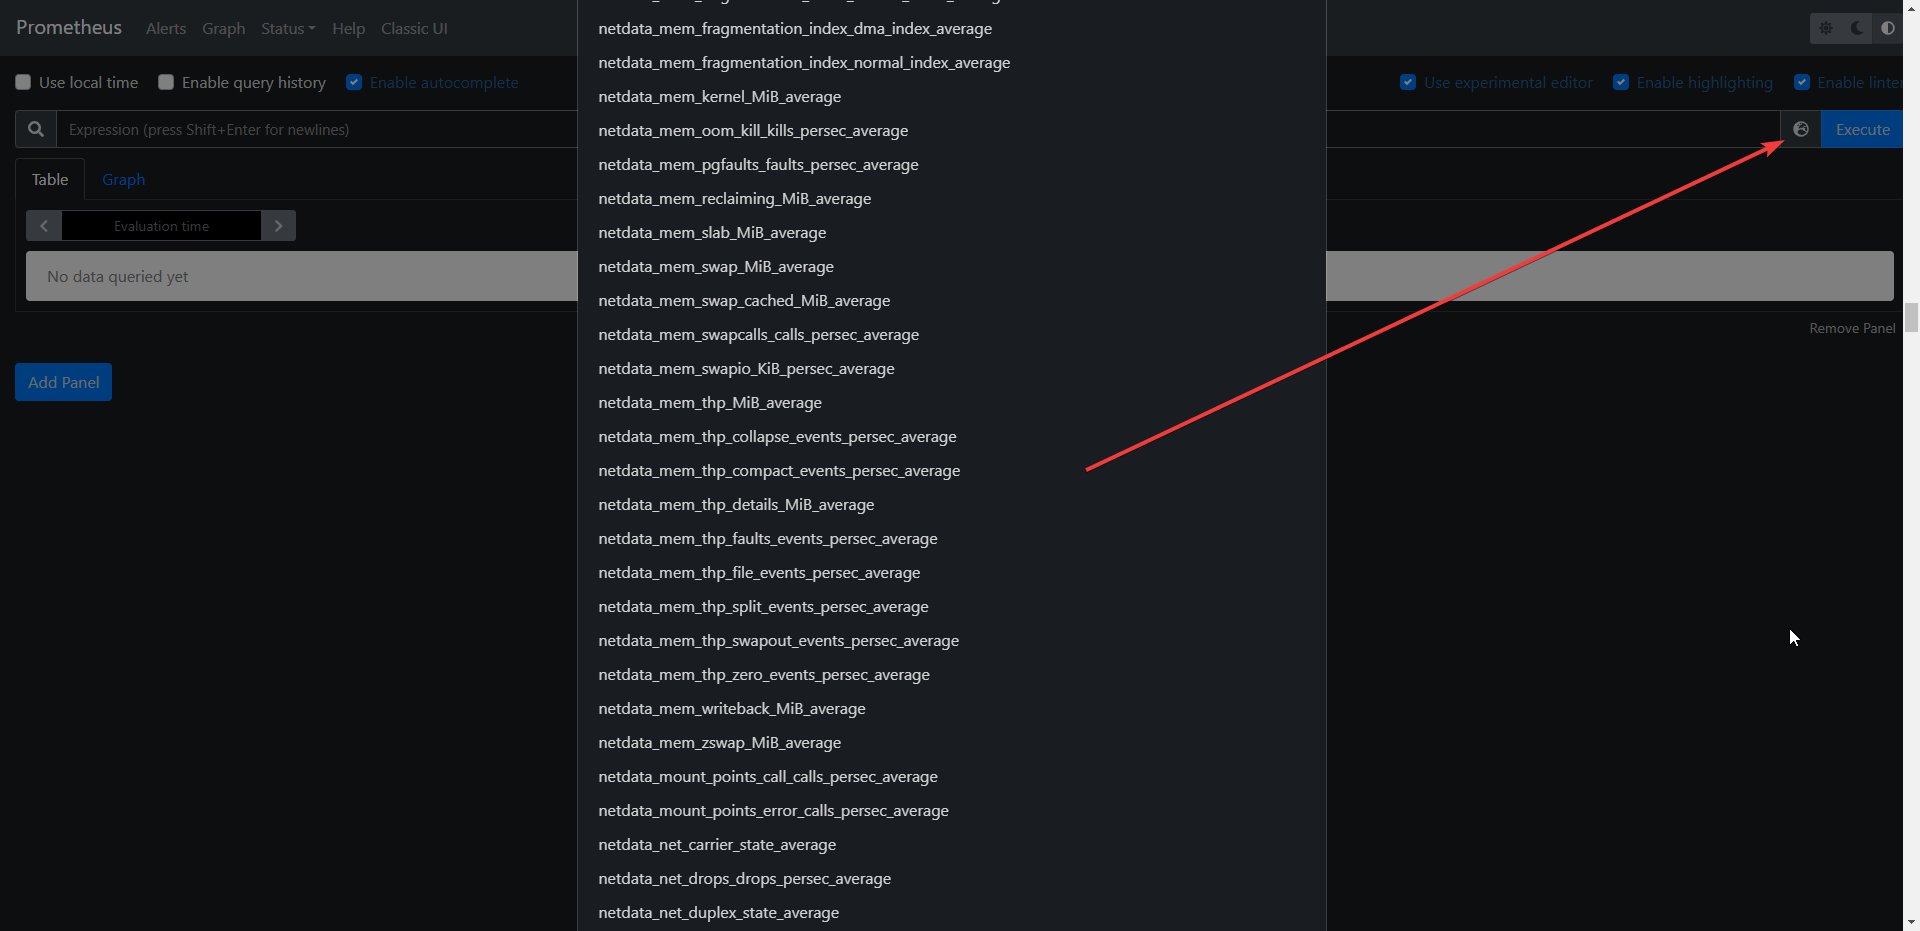
Before we start sending data to Grafana, we need to know where to find everything in Prometheus. To get started, click on the small globe icon next to the search bar. This will show you a list of all the metrics that Netdata is sending to Prometheus. It might look like a lot, but don't worry, Prometheus makes it easy to sort through them and pick out exactly what we want to show on our Grafana dashboard.
Now that you're familiar with locating metrics in Prometheus, it's the perfect moment to set up Grafana and prepare it to fetch the specific metrics we've selected from Prometheus.
Install Grafana on the host machine
To set up Grafana, we'll make use of the official Grafana Docker image. I've taken the Docker run command and translated it into a Docker Compose configuration for those who prefer deploying it with Portainer.
version: '3.9'
services:
    grafana:
        image: grafana/grafana
        ports:
            - '3000:3000'
        container_name: grafana
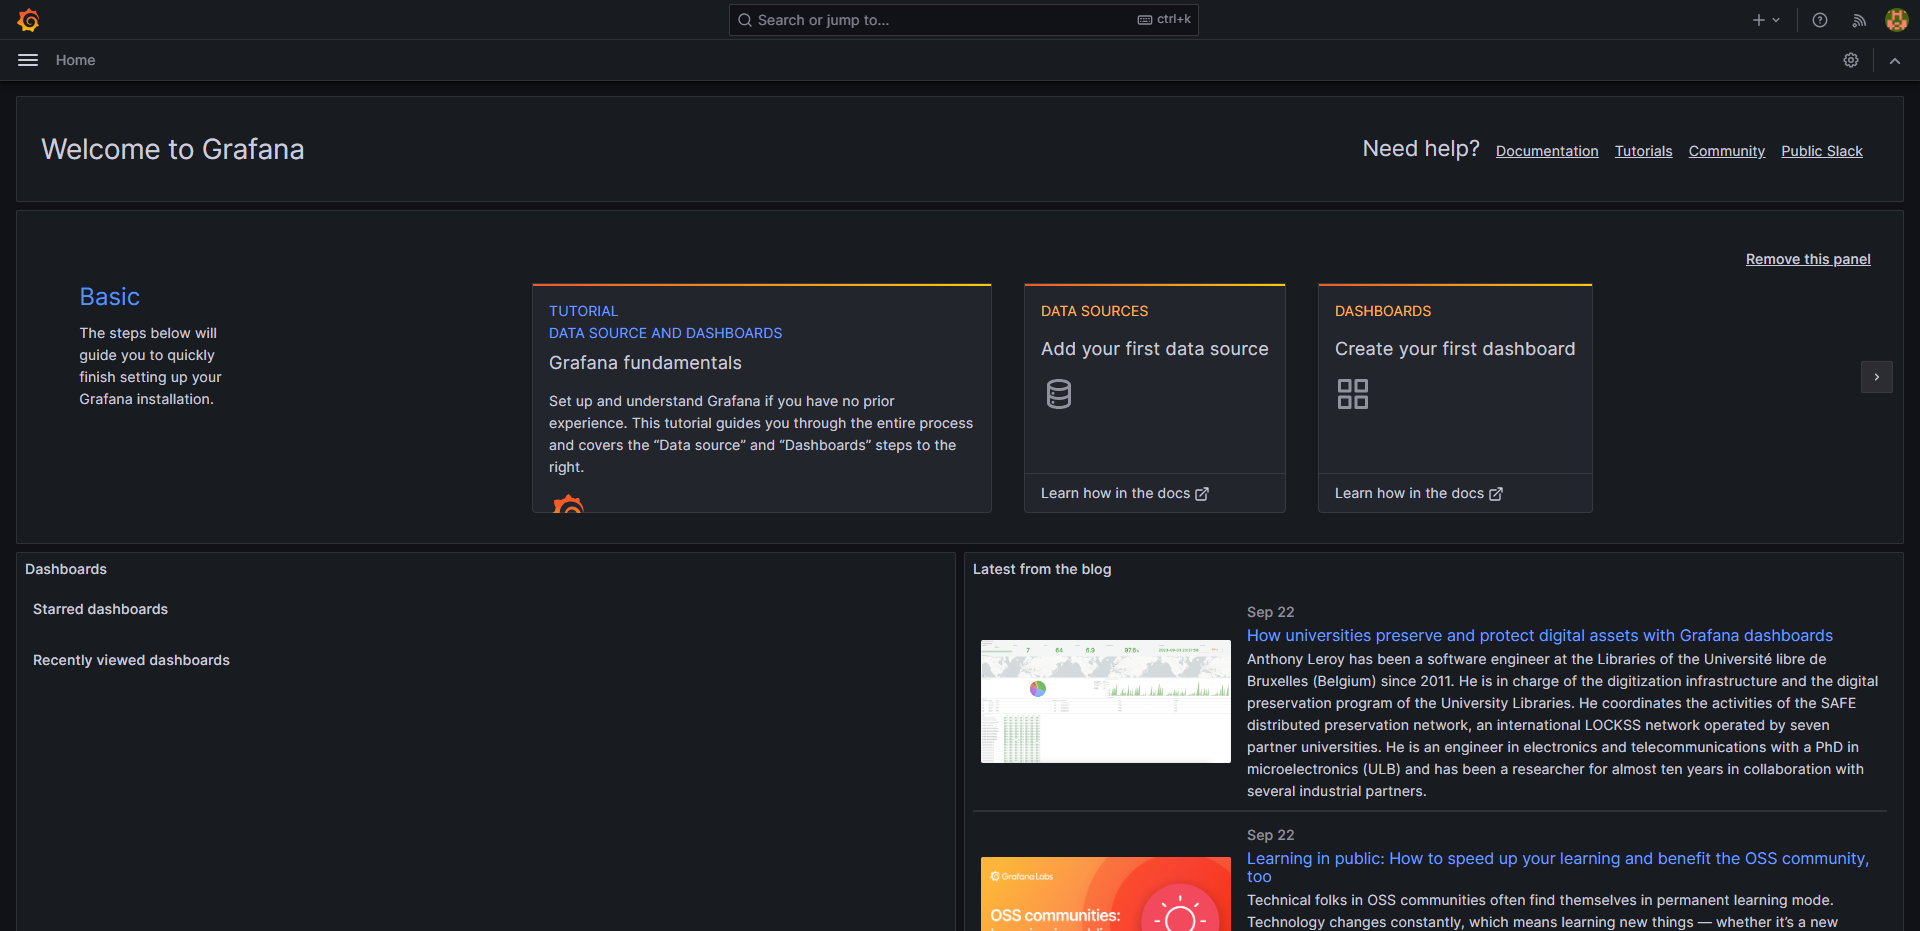
To access Grafana, visit the web UI in your browser on your host machine's IP address followed by the port 3000. Use the default username and password, which are both "admin." Be aware that you'll need to input it twice to log in, so don't be surprised if it doesn't work on the first attempt. It's a good idea to change the password right away for added security.
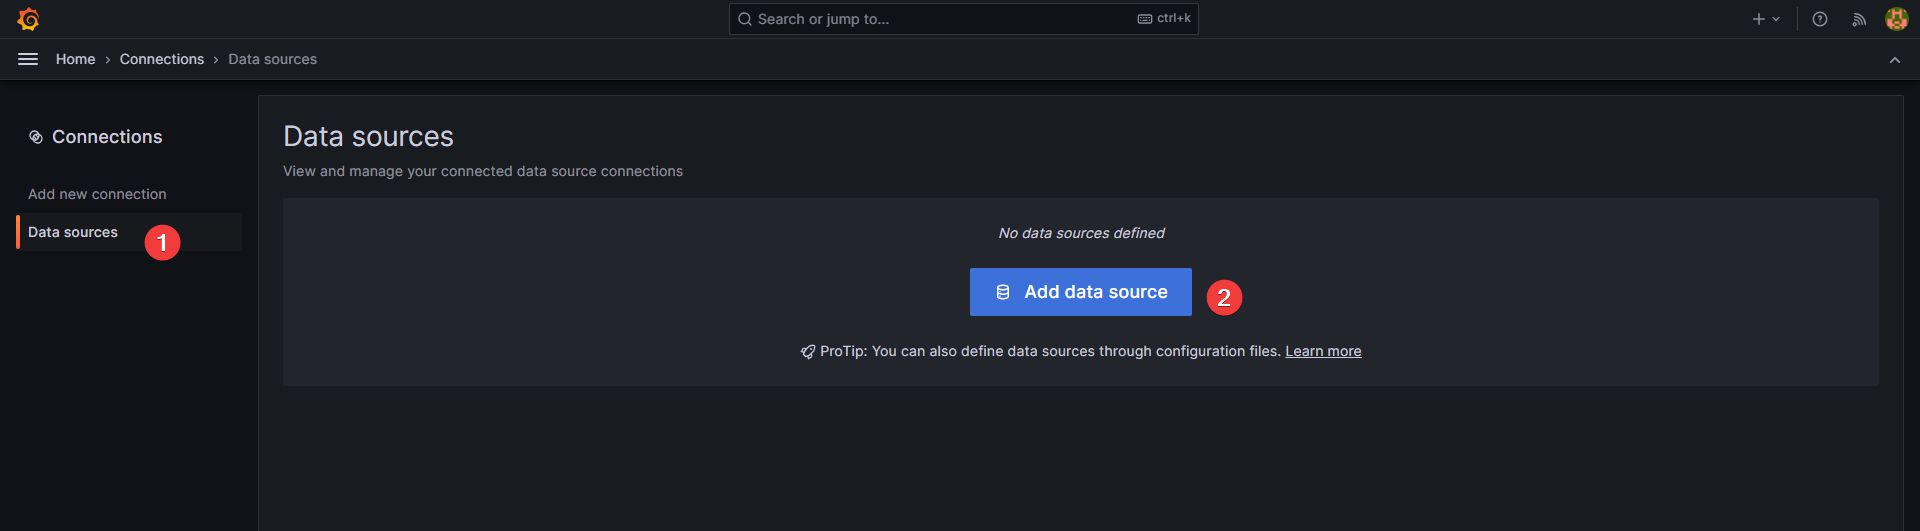
Next, let's integrate Prometheus as a data source in Grafana. Within Grafana, go to "Connections," then select "Data sources," and finally, click the "Add data source" button in blue.
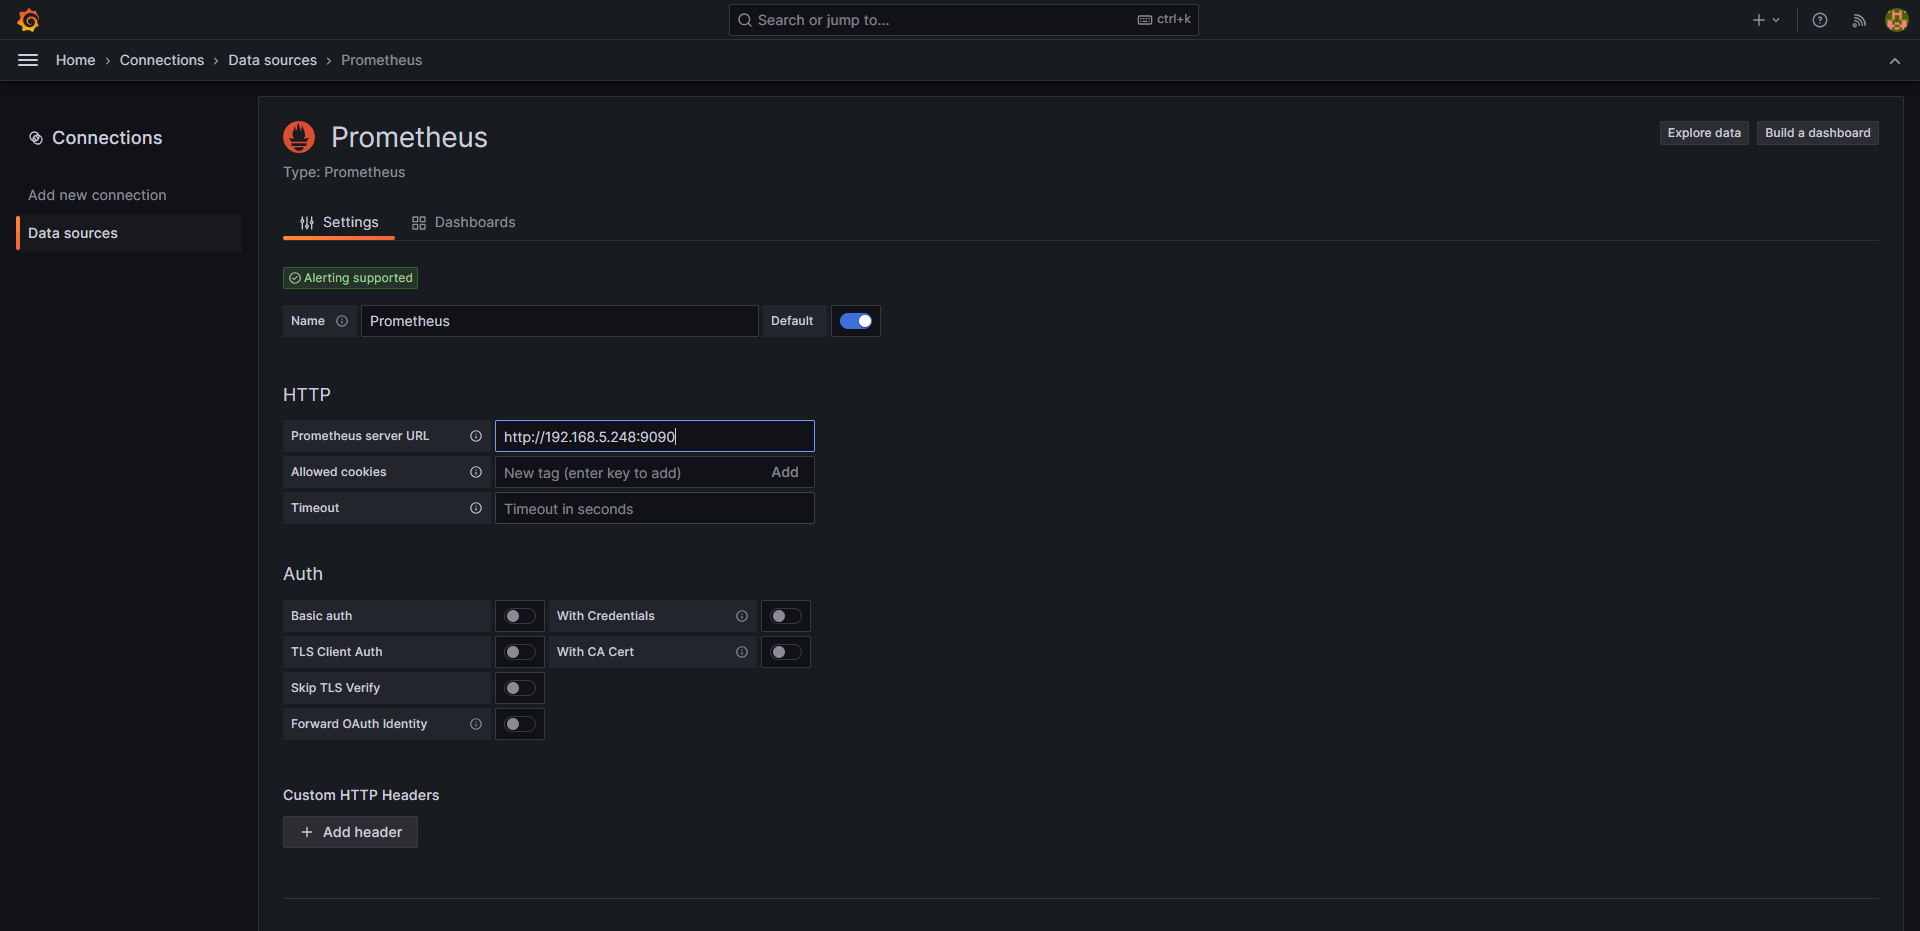
If you can't spot Prometheus on the list, don't worry. You can simply use the search bar to find it. Once you've located Prometheus, click to add it as a data source and then fill in the required information. All you really need to provide is the Prometheus server URL, which is essentially the IP and port where Prometheus is installed. You can keep the name as is, and for now, there's no need to tinker with any other settings. You can scroll to the bottom and click "Save and test".
Now, let's get creative and craft a new dashboard in Grafana. Start by clicking on the hamburger menu located in the upper left corner to open up the side panel. Then, hit "Dashboards." Since this is a fresh setup, you'll only find the "General" folder here. To create your dashboard, click the blue "New" button and choose "Import." I've provided a basic dashboard to help you get the hang of Grafana and make things easier for you. This will give you a better understanding of how the metrics from Prometheus play a role in Grafana. You can browse the Prometheus metrics later after we setup this example dashboard and get familiar with how it works.
Download the file then upload it using the Grafana import uploader. Be sure to select Prometheus as the data source before clicking "Import".
Now, the next step is to make a few tweaks to the cards so they display your system stats. Right now, these cards are set up with data from my system. To personalize them, you can simply edit each card and adjust the IP address and job name (the job name you wrote in the prometheus.yml file) to match your own. You can edit them by hovering over the card at the top then clicking the three dot menu in the upper right corner.

After making these changes, click "Apply" in the upper right corner. Don't forget to repeat this process for every card, and remember to save the dashboard once you're done.

Let's pause for a moment to grasp how this all comes together. Netdata is like our stats provider, serving up all the system data. This data gets channeled into Prometheus, which does the job of neatly organizing and indexing all those metrics into a simple, searchable database. From there, we handpicked a handful of those metrics to showcase in Grafana, giving us the visual insights you see in the dashboard we imported.
Now, go ahead and dive into the Grafana dashboard and start tinkering with those cards. I encourage you to roll up your sleeves, dig into the Prometheus metrics, and compare them with what Netdata offers, so you really get a feel for what each metric does. And don't hesitate to expand your dashboard further if you wish. Think of the dashboard I've shared as a stepping stone, a starting point to craft a more personalized and detailed dashboard that perfectly fits your monitoring needs.

Final Notes and Thoughts
As you become more comfortable with how these apps work, you'll discover a treasure trove of fantastic possibilities. There are exporters available for various tools, including log viewers, databases, Docker container stats, and even applications like Radarr, Sonarr, and SabNZB, among others. You can find a list of these Netdata integrations right here. Here is the Prometheus exporter index, so the potential for enhancing your monitoring experience is virtually limitless.
If you have any questions, drop a comment below or join us on Discord.


Discussion