

I've always admired those pristine homelab diagrams people post on Reddit. The ones with perfect spacing, color-coded VLANs, and every service neatly labeled. Meanwhile, my network documentation lived entirely in my head - a vague mental model that got fuzzier every time I added another container at 2am. I kept telling myself I'd sit down with Draw.io or Excalidraw and finally map it all out, but let's be honest, that was never going to happen. So naturally I did what any good homelabber would do, went the technical overkill route, and built an open-source tool to do it for me! 😅
What is Scanopy?
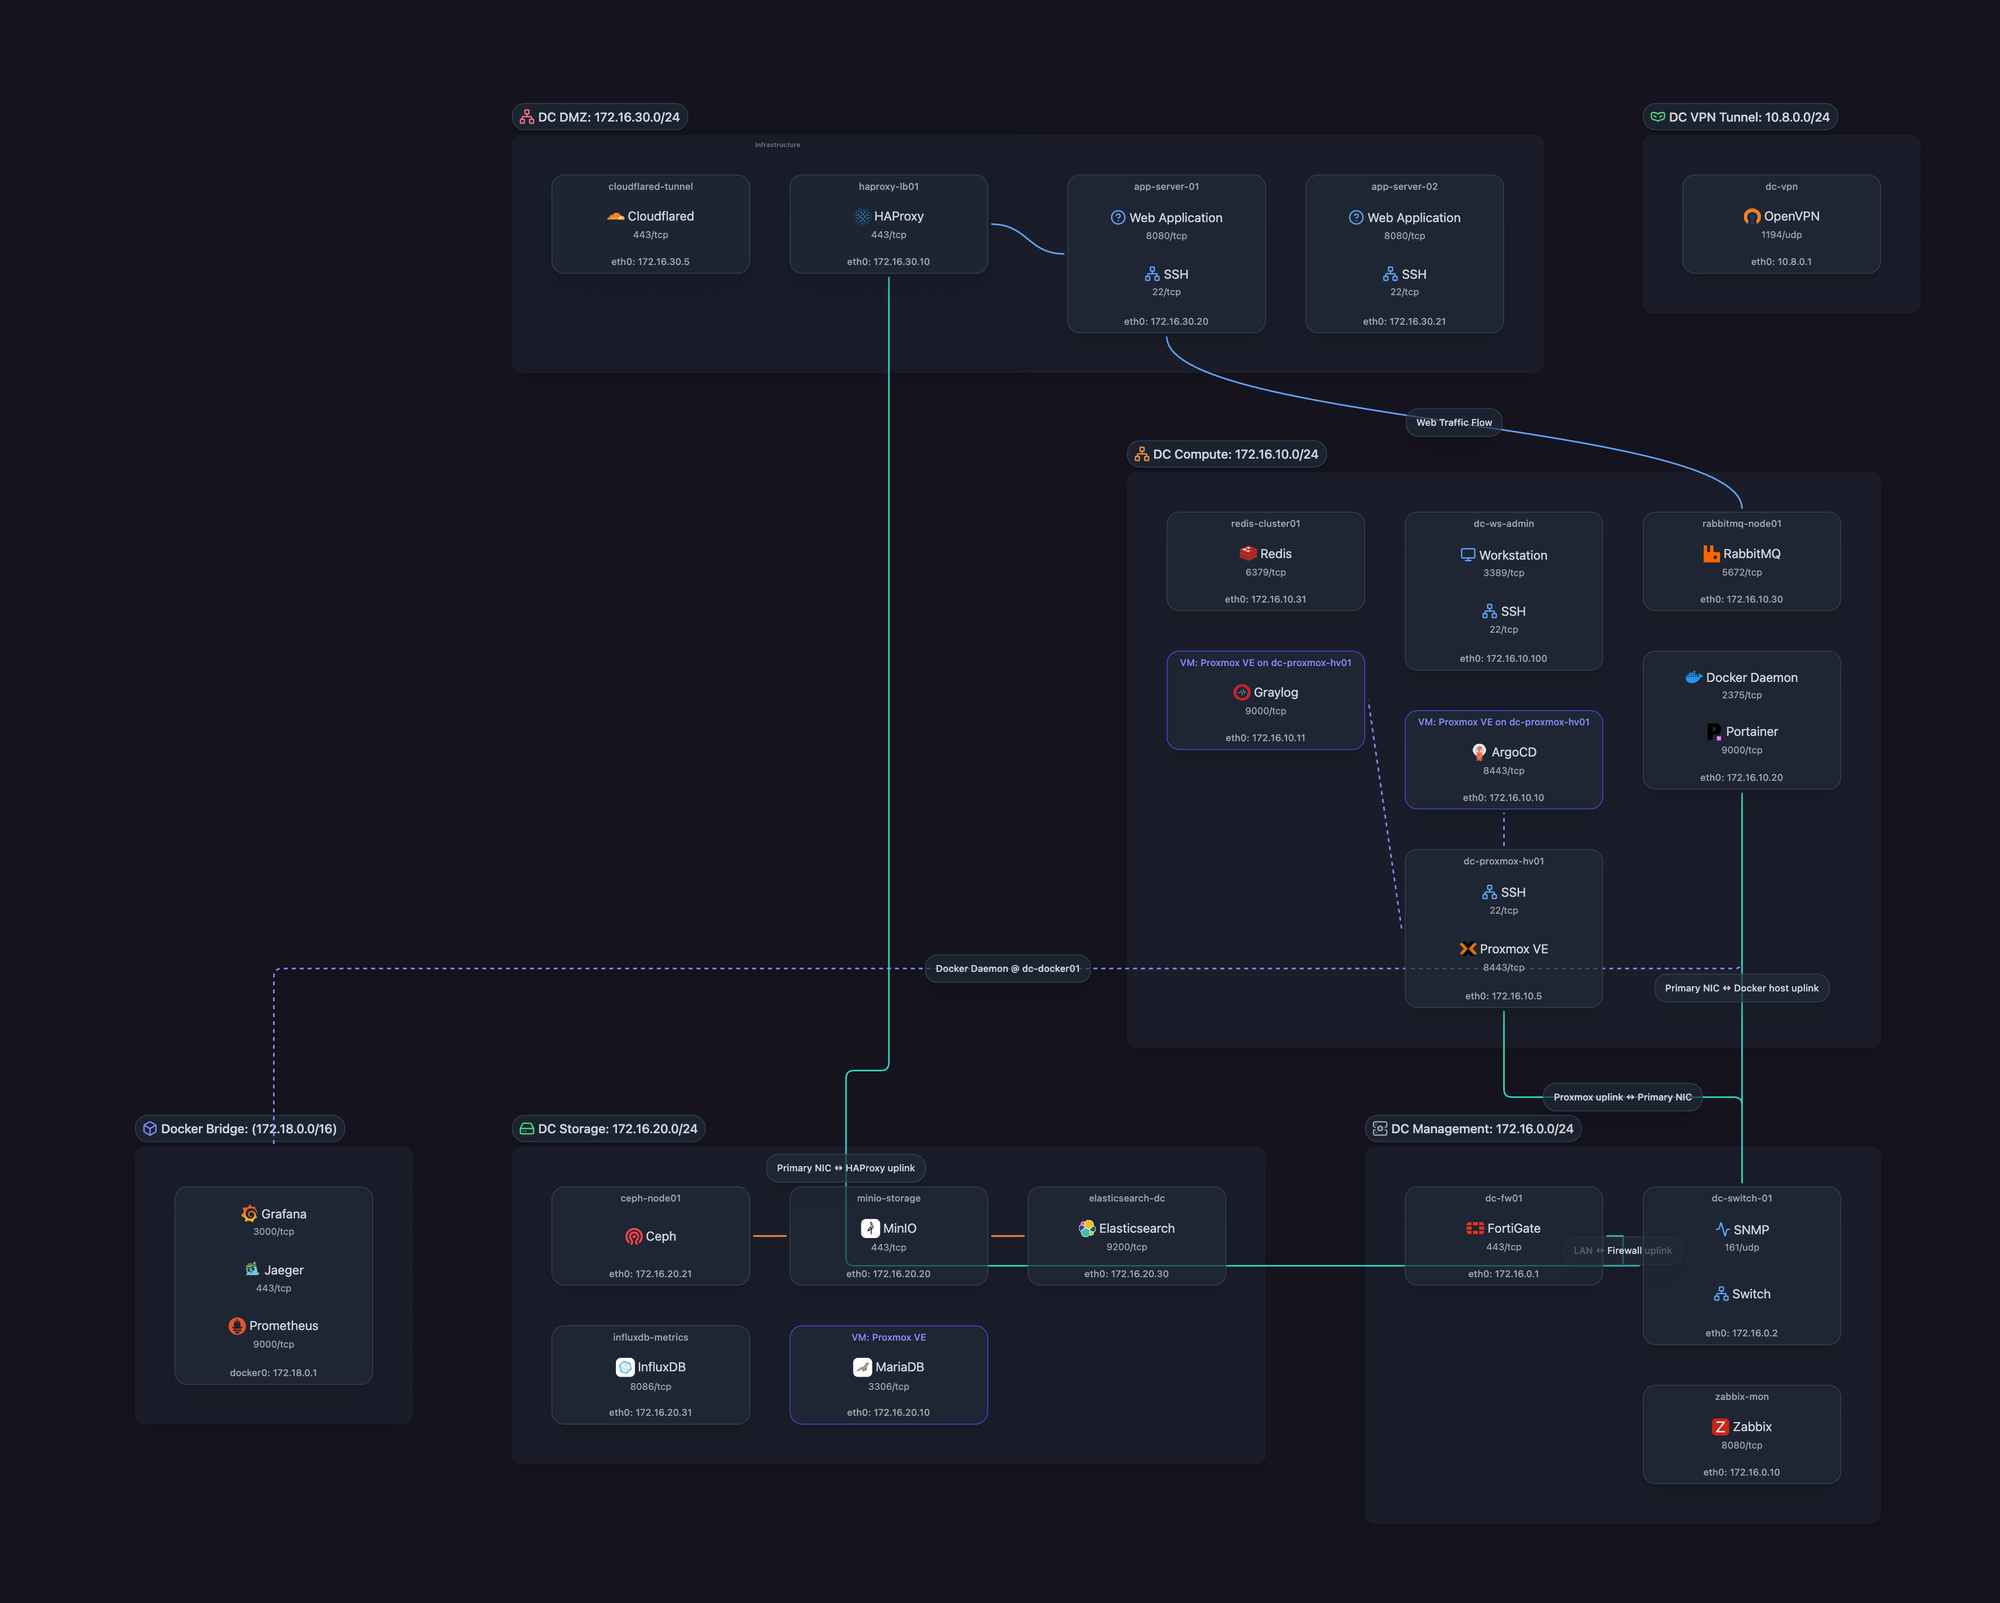
Scanopy automatically discovers and visually documents your network topology. It scans your network, identifies hosts and services, and generates an interactive visualization showing how everything connects. Think of it as living documentation that updates itself: no more diagrams that become historical artifacts the moment you spin up a new VM.
The daemon scans IP addresses on the VLANs it's connected to, uses pattern matching on open ports and endpoint responses to detect common self-hosted services (Home Assistant, Plex, Jellyfin, and 200+ others), and reports everything back to the server. The server then generates an interactive visualization you can actually use.
Getting Started
The setup is straightforward - you run a server and one or more daemons. The server hosts the UI and stores your network data. The daemons do the actual scanning and can be deployed across different network segments if you have multiple VLANs.
Both the server and daemon are dockerized. You can easily get up and running using this docker compose and following the instructions in the documentation.
Discovery
Discovery time depends on network size and how many hosts are responsive; a /24 usually takes ~30 minutes. The daemon performs ARP scanning to find hosts even if they don't have open ports, scans all 65k ports on hosts that are responsive, and checks the Docker socket on its host to detect running containers. Any services it can't identify get collected in an "Unclaimed Ports" bucket, and there's a UI feature that lets you easily assign those ports to services if you know what they are.
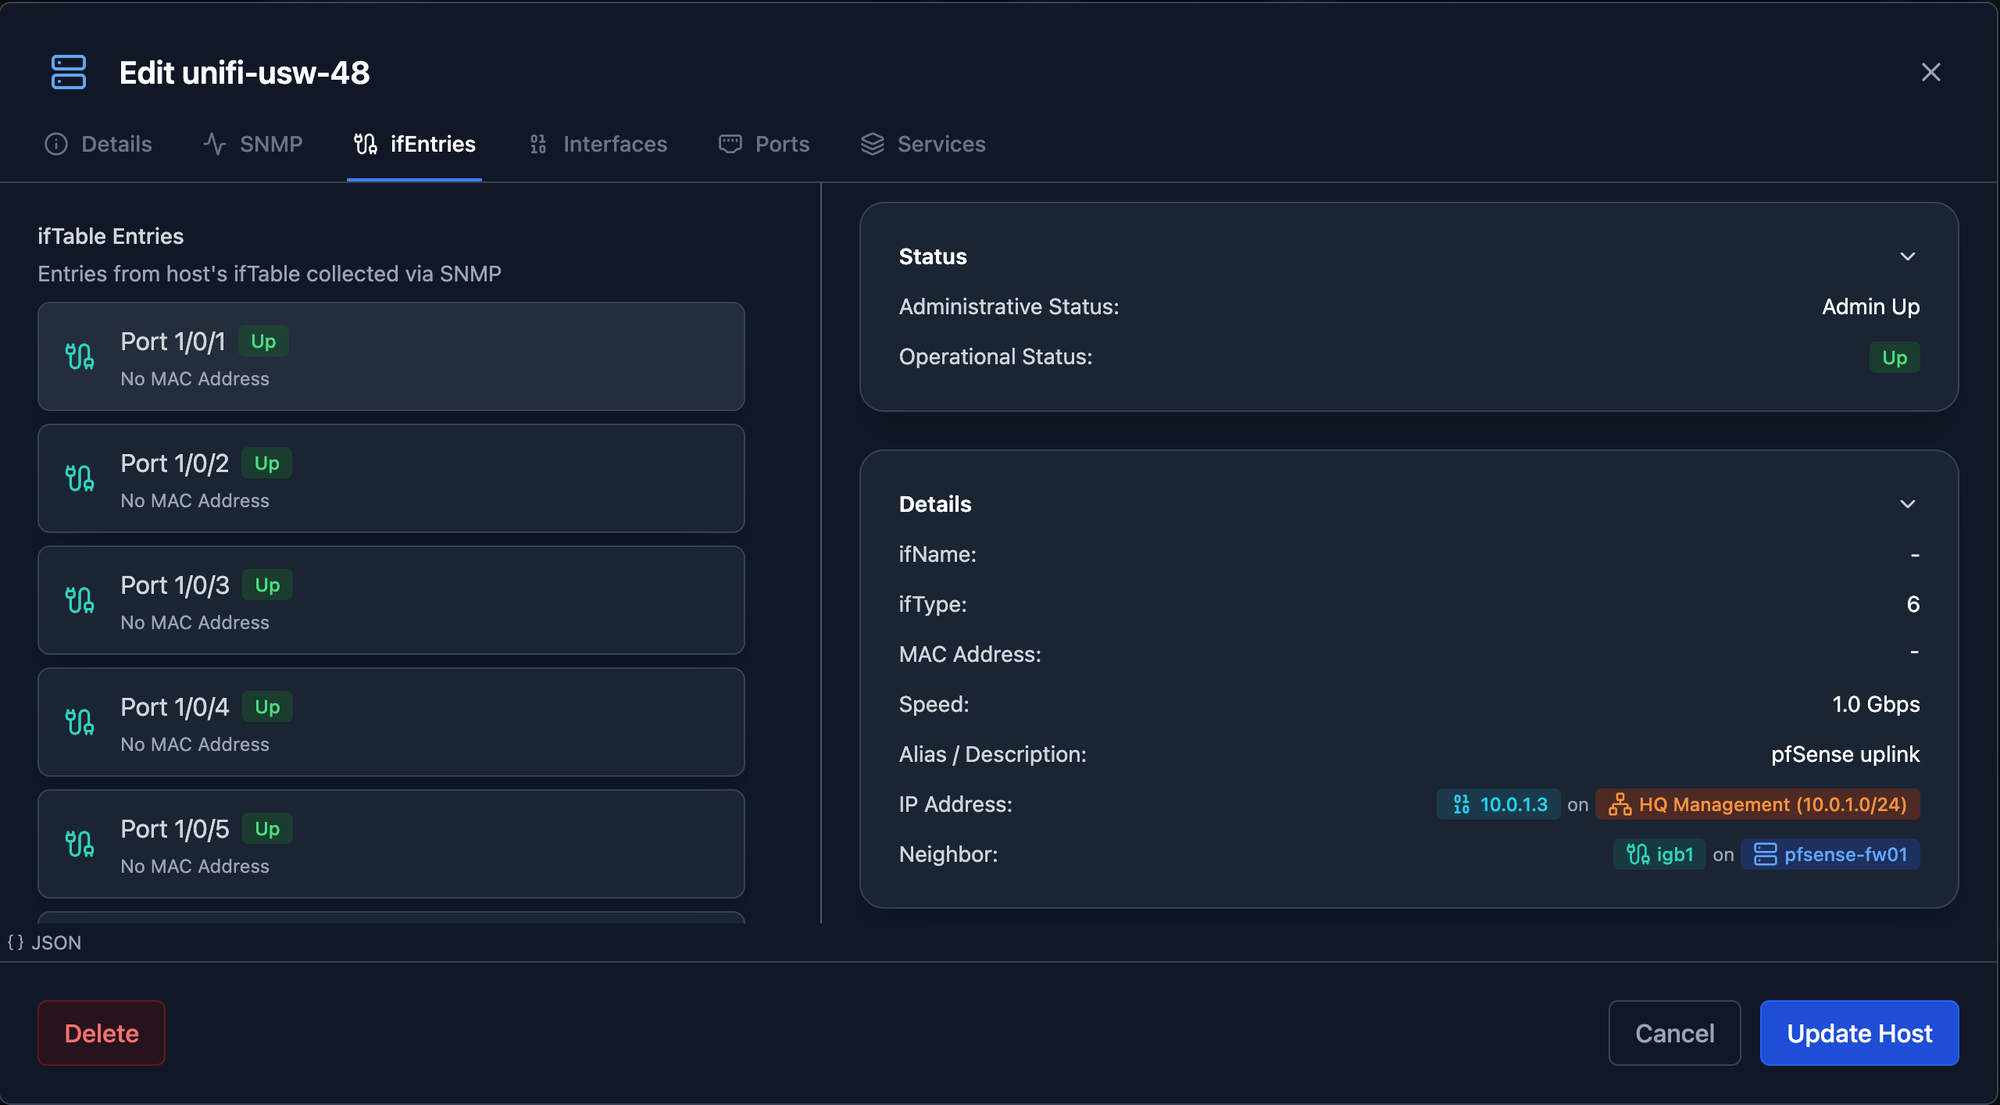
Scanopy also supports SNMP v2c polling for network devices - switches, routers, access points, etc. You configure SNMP credentials at the organization level and set defaults per-network. Scanopy pulls interface tables, system info, and - this is the cool part - LLDP/CDP neighbor data. This means Scanopy can discover how your network devices are physically connected to each other and show those links in your topology.
The Visualization
This is the part I'm most proud of. The topology view is fully interactive - clicking a host highlights everything connected to it and opens an info panel. You can save, version, and branch your topologies to track how your network evolves over time. Lock a topology if you want to preserve a specific view without incoming scan data disrupting it.
You can also edit edges directly in the visual (line colors, routing styles like step, straight, or bezier), organize hosts into groups with hub-and-spoke layouts, and toggle whether ports are visible. You can share diagrams via public links or embed them directly into wikis and documentation pages.
API & Data Export
You can generate your own API keys with granular permissions and network scoping. This opens up building integrations, automating workflows, or giving limited access to specific parts of your infrastructure without sharing full credentials.
You can also export pretty much any entity type to CSV - hosts, subnets, interfaces, ports, services, and more. Great for reporting, audits, or just getting your data out.
What's Next
I'd love to hear what would make Scanopy more useful for you. Currently, i'm exploring a refactor of the topology visualization engine to make it more flexible which would allow for a physical as well as logical network visualization along with more customization in general. I'm also thinking about a feature that would add change tracking so you can understand what changes on your network between discovery runs.
If you build an integration with the API, let me know about it - I'm hoping to showcase community integrations and eventually build out a proper plugin system based on what people are actually building.
Scanopy is AGPL-3.0 licensed and completely open source. If it doesn't detect a service you're running, contributing a service definition is one of the easiest ways to get involved - the community has already added support for over 200 services this way.
Links


Discussion