


I know, I've been on an n8n kick lately but that's because n8n is awesome and I am really enjoying using it to help automate my workflows and make my life easier. I want to start by adding I am no expert in n8n... yet. But I am learning as I go and I enjoy sharing what I learn here with you!
Today I want to show you how I keep an eye on my HDD health using n8n. It’s a setup I’ve put together that quietly monitors my drives in the background and alerts me if anything starts to go wrong, so I don’t have to worry about losing data.
If you haven't installed n8n yet, check out my article here that explains how to get started self-hosting n8n.
For this workflow, I’m using the following key nodes:
- Schedule Trigger – to check my drives every morning when I wake up
- SSH: Execute a command – to connect to my server and pull the health data using SmartMonTools
- HTTP Request – to send notifications via ntfy letting me know the health status of my drives
I’m going to walk you step by step through how to put these nodes together, how the data flows, and how to get alerts so you can set up something similar for yourself. It’s not complicated, and it’s surprisingly satisfying to see it all run automatically.
Creating the Workflow
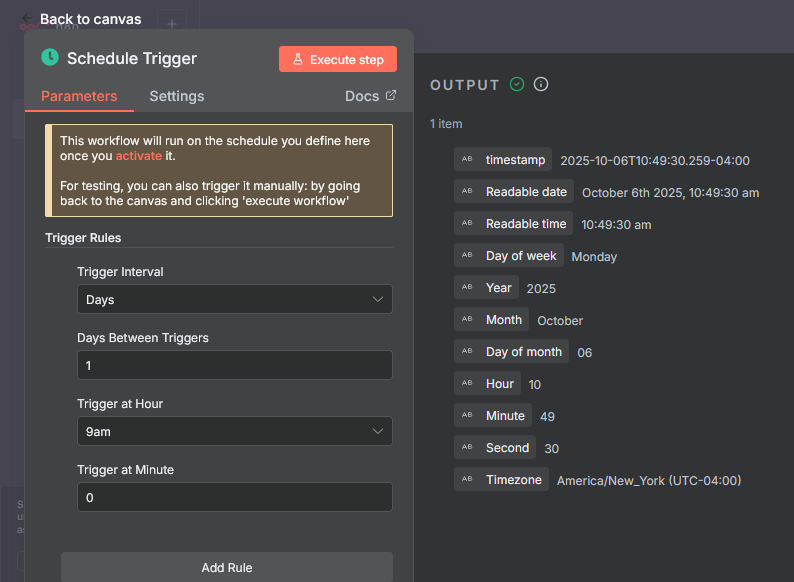
- Add a Schedule Trigger node. Adjust the days and times you want to have this workflow run. I have mine set to every day at 9am.
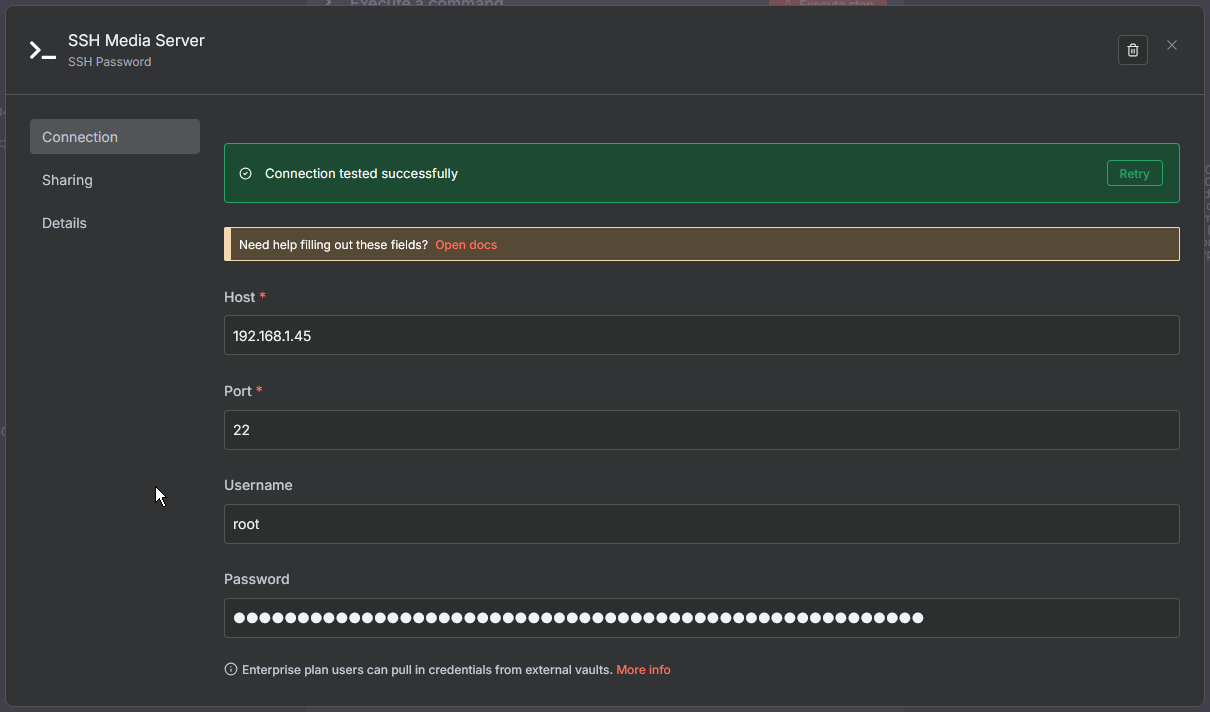
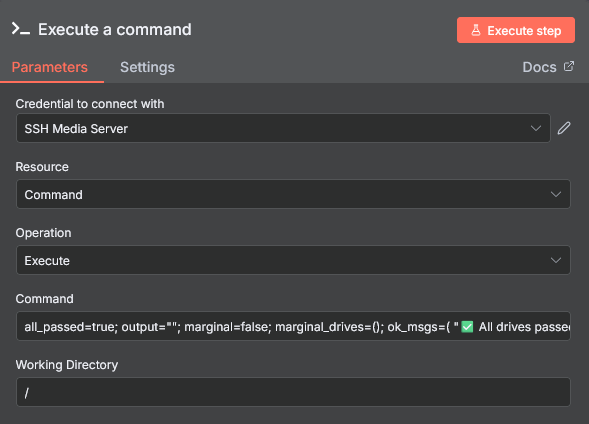
- Add the SSH node and select the “Execute a command” option, then connect it to your trigger. Double click the SSH node to set up the credentials for the machine you want to monitor. This can be a local or remote machine. You can give the credentials a custom name. I called mine “SSH Media Server” to make it clear which server I am connecting to.
Make sure SmartMonTools is installed on the machine where you want to monitor the disks. On Debian or Ubuntu, you can install it by running the following commands:
sudo apt install smartmontoolsAdd the following command into the "Command" field on the SSH node:
all_passed=true; output=""; marginal=false; marginal_drives=();
ok_msgs=(
"✅ All drives passed with flying colors."
"😎 Every single drive passed — smooth sailing ahead."
"🚀 All drives passed and ready for takeoff."
"💪 Every drive checked out strong — no weak links here."
"🧠 SmartMon says all drives passed. Your setup’s sharp."
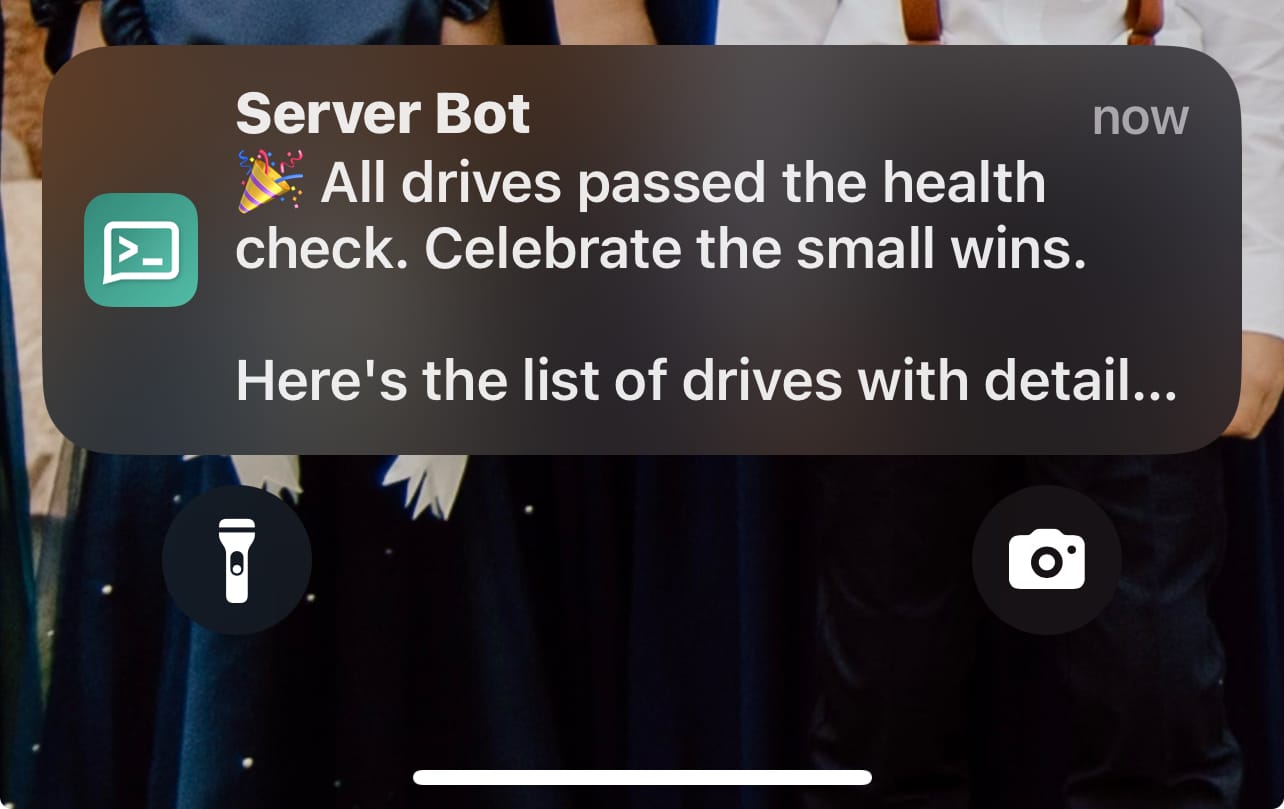
"🎉 All drives passed the health check. Celebrate the small wins."
"🧊 All drives passed and running good!"
"🛠️ All drives passed diagnostics. No issues detected."
"🌟 Every drive passed. You’ve got a rock-solid array."
"📀 All drives passed — clean results across the board."
);
bad_msgs=("⚠ Some drives need attention." "😬 Something’s not looking good…" "🧯 One or more drives might be struggling." "🩺 Drive health check: needs a doctor." "💀 Uh oh, we’ve got a problem drive.");
for d in $(lsblk -dn -o NAME | grep -vE '^(loop|loop[0-9]+|zram[0-9]+)$'); do
if [[ $d == nvme* ]]; then
status=$(sudo smartctl -H /dev/$d | awk '/SMART overall-health/ {print $6}');
reallocated=0;
tempC=$(sudo smartctl -A /dev/$d | awk -F: '/Temperature/ {gsub(/ /,"",$2); print $2}');
tempC=${tempC:-0};
poh=$(sudo smartctl -A /dev/$d | awk -F: '/Power On Hours/ {gsub(/ /,"",$2); print $2}');
poh=${poh:-0};
cps=0; ou=0;
else
status=$(sudo smartctl -H /dev/$d | awk '/SMART overall-health/ {print $6}');
reallocated=$(sudo smartctl -A /dev/$d | awk '/Reallocated_Sector_Ct/ {print $10}');
reallocated=${reallocated:-0};
tempC=$(sudo smartctl -A /dev/$d | awk '/Temperature_Celsius/ {print $10}');
tempC=${tempC:-0};
poh=$(sudo smartctl -A /dev/$d | awk '/Power_On_Hours/ {print $10}');
poh=${poh:-0};
cps=$(sudo smartctl -A /dev/$d | awk '/Current_Pending_Sector/ {print $10}');
cps=${cps:-0};
ou=$(sudo smartctl -A /dev/$d | awk '/Offline_Uncorrectable/ {print $10}');
ou=${ou:-0};
fi;
[[ "$status" != "PASSED" ]] && all_passed=false;
if [[ $reallocated -gt 0 || $cps -gt 0 || $ou -gt 0 ]]; then marginal=true; marginal_drives+=("$d"); fi;
output+="$d: $status (Reallocated: $reallocated, Temp: ${tempC}C, POH: $poh, CPS: $cps, OU: $ou)\n";
done;
if $all_passed; then msg=${ok_msgs[$RANDOM % ${#ok_msgs[@]}]}; else msg=${bad_msgs[$RANDOM % ${#bad_msgs[@]}]}; fi;
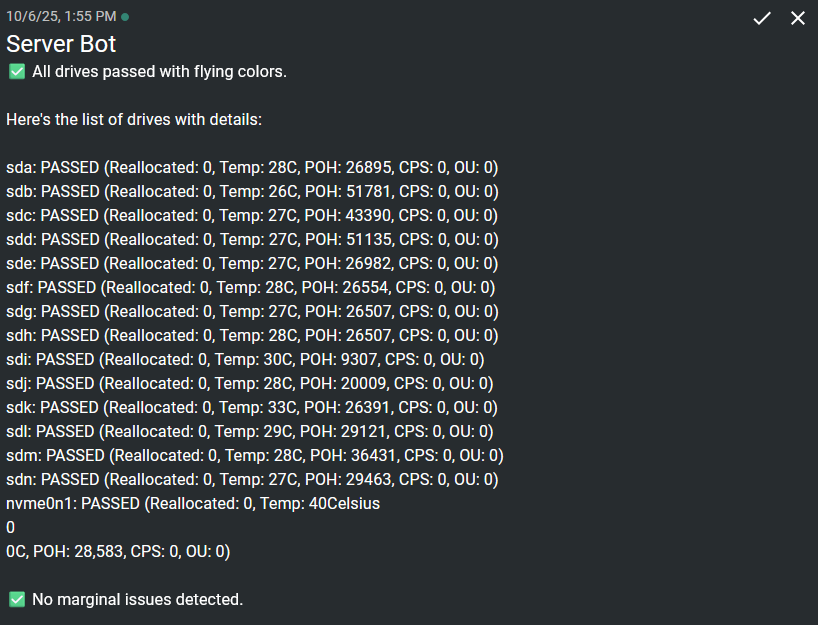
echo -e "$msg\n\nHere's the list of drives with details:\n\n$output";
if $marginal; then echo "⚠ Minor issues detected on: ${marginal_drives[*]}."; else echo "✅ No marginal issues detected."; fi
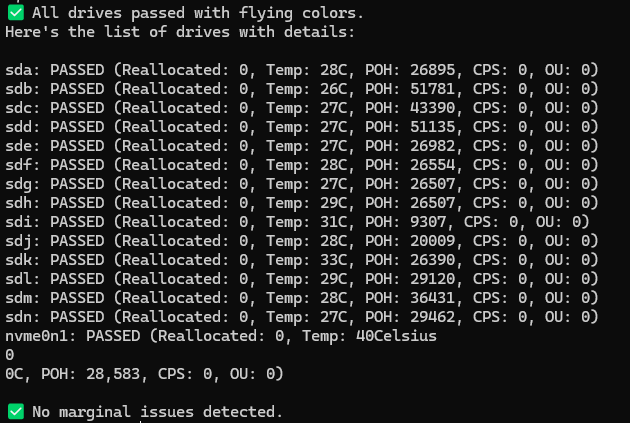
This creates a very simple list showing only the drives with a PASSED or FAILED status, reallocated sector counts, temp in Celsius and Power on Hours. You can test it in your terminal to see the output. It chooses a message to display at the top if all drives have passed. If all drives have not passed it will choose 1 of 5 messages to let you know there are issues instead.
I know some of you might call this "AI slop" since I used AI to help generate the command/script. The emojis are a tell tale sign but I left them in because they bring attention better when I get push notifications. I still spent a good amount of time tweaking it to get it just right though! Feel free to simplify or modify it however you like.
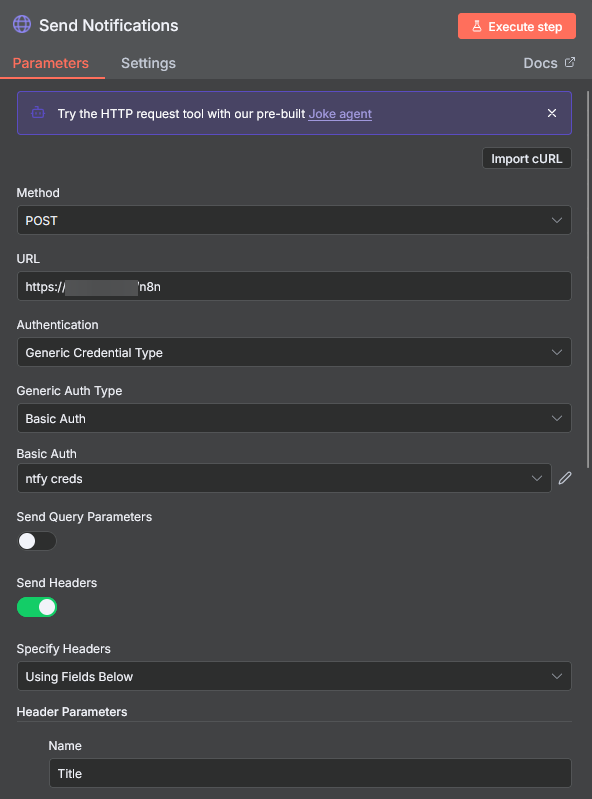
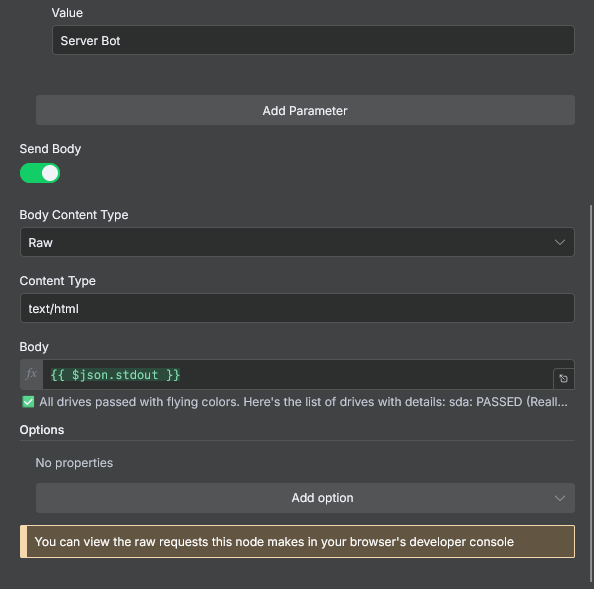
- Add the HTTP Request node. Double click the node and add the following:
Click on the "Import cURL" button and paste your ntfy topic cURL command. It will look like this.
You can get the cURL command from your ntfy web GUI. Clear all the notifications from the topic and it will be visible like this:
curl -d "Server Bot" ntfy.yourdomain.com/n8n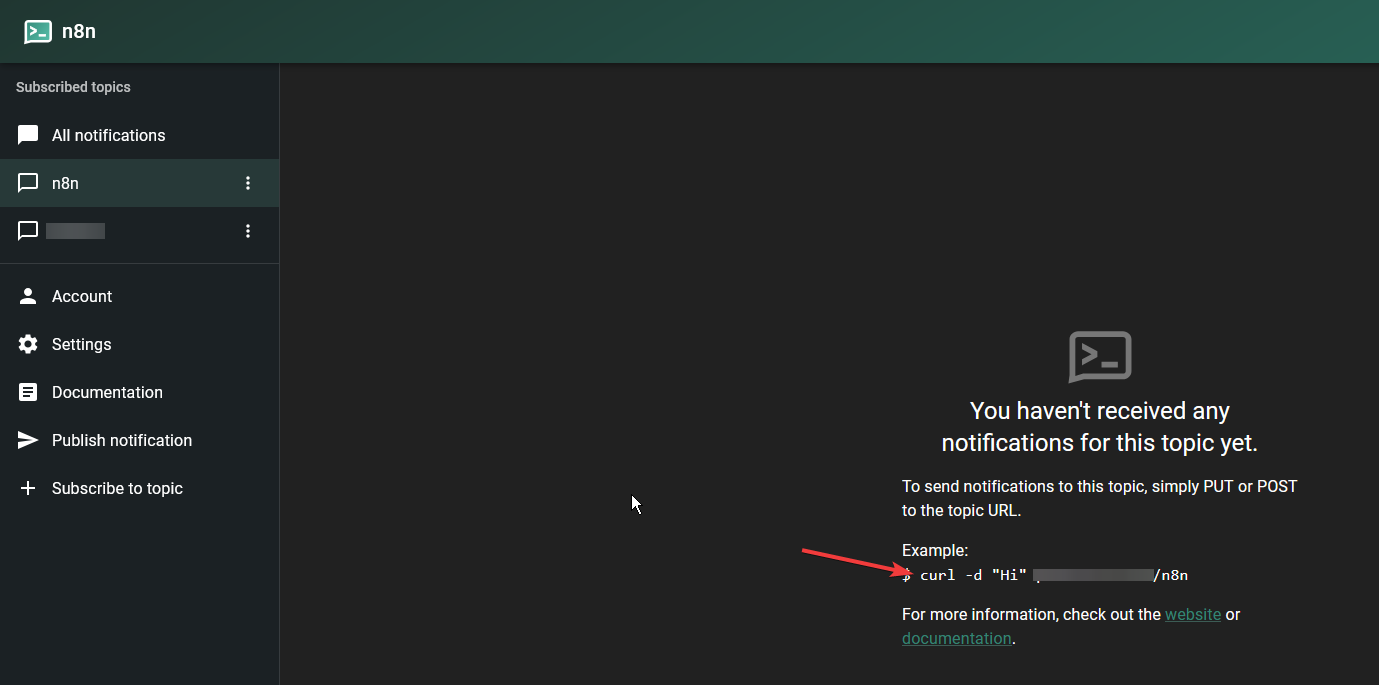
You will have to add your ntfy credentials to the node too. We talk more about that in the ntfy article here.
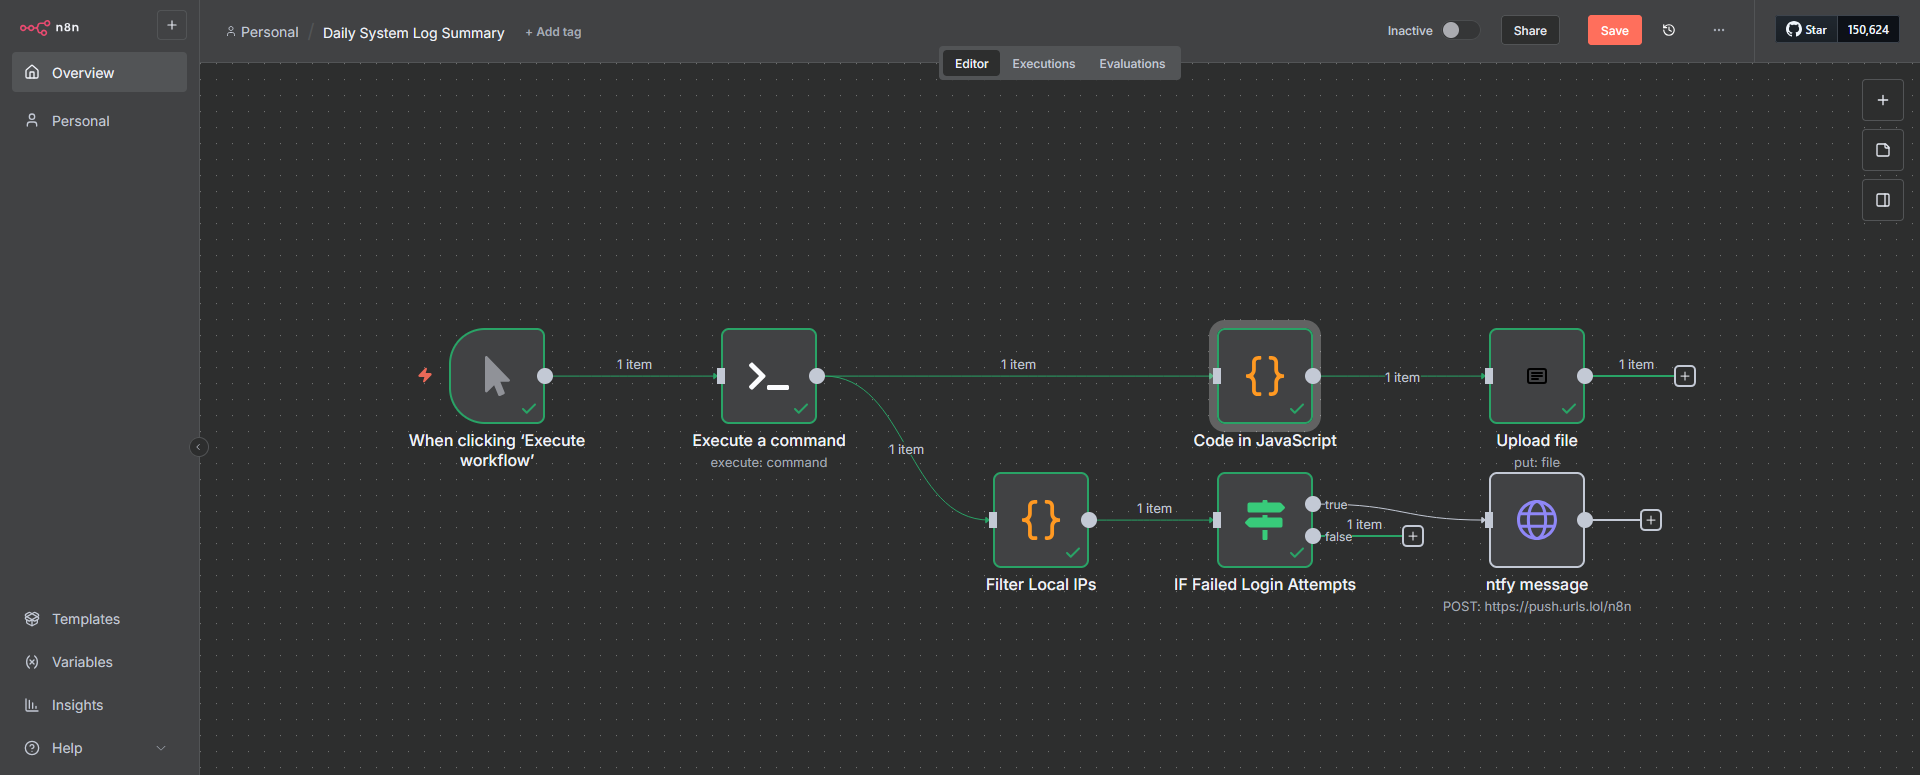
Your workflow should look like this. It's pretty basic but all the gibberish between was me mostly trying to explain what to do for each node.

Test the workflow, and it should deliver the output to your ntfy instance on both your phone and the web interface. Make sure to subscribe to the same topic on your phone if you want to receive alerts there as well.
Be sure to activate the workflow in the top right so it runs automatically. If you have any questions, feel free to ask either in the comments or on our Discord server.
Final Notes and Thoughts
This is one of those things I probably don’t need, but it’s reassuring to know if a drive is starting to fail before it actually dies. This little n8n workflow gives me peace of mind every morning when I start my day. Monitoring 13 drives isn’t easy, but this makes it effortless.
If you want to push n8n to the next level, you can do some pretty wild things with AI. You could even build your own AI IT manager to monitor your entire server. Do I recommend it? Not really, but check out this video by Network Chuck for some cool ideas!


Discussion