


This project started as a way for me to bring more visibility to what’s happening on my Ubuntu server without needing to dig through logs manually. Using n8n, I built a workflow that reads system logs, parses out key details, and turns them into a clean HTML dashboard I can download or preview. Along the way, I added live counts, colors, and alerts for failed SSH login attempts.
The best part? It’s all simple, script-driven, and easy to maintain.


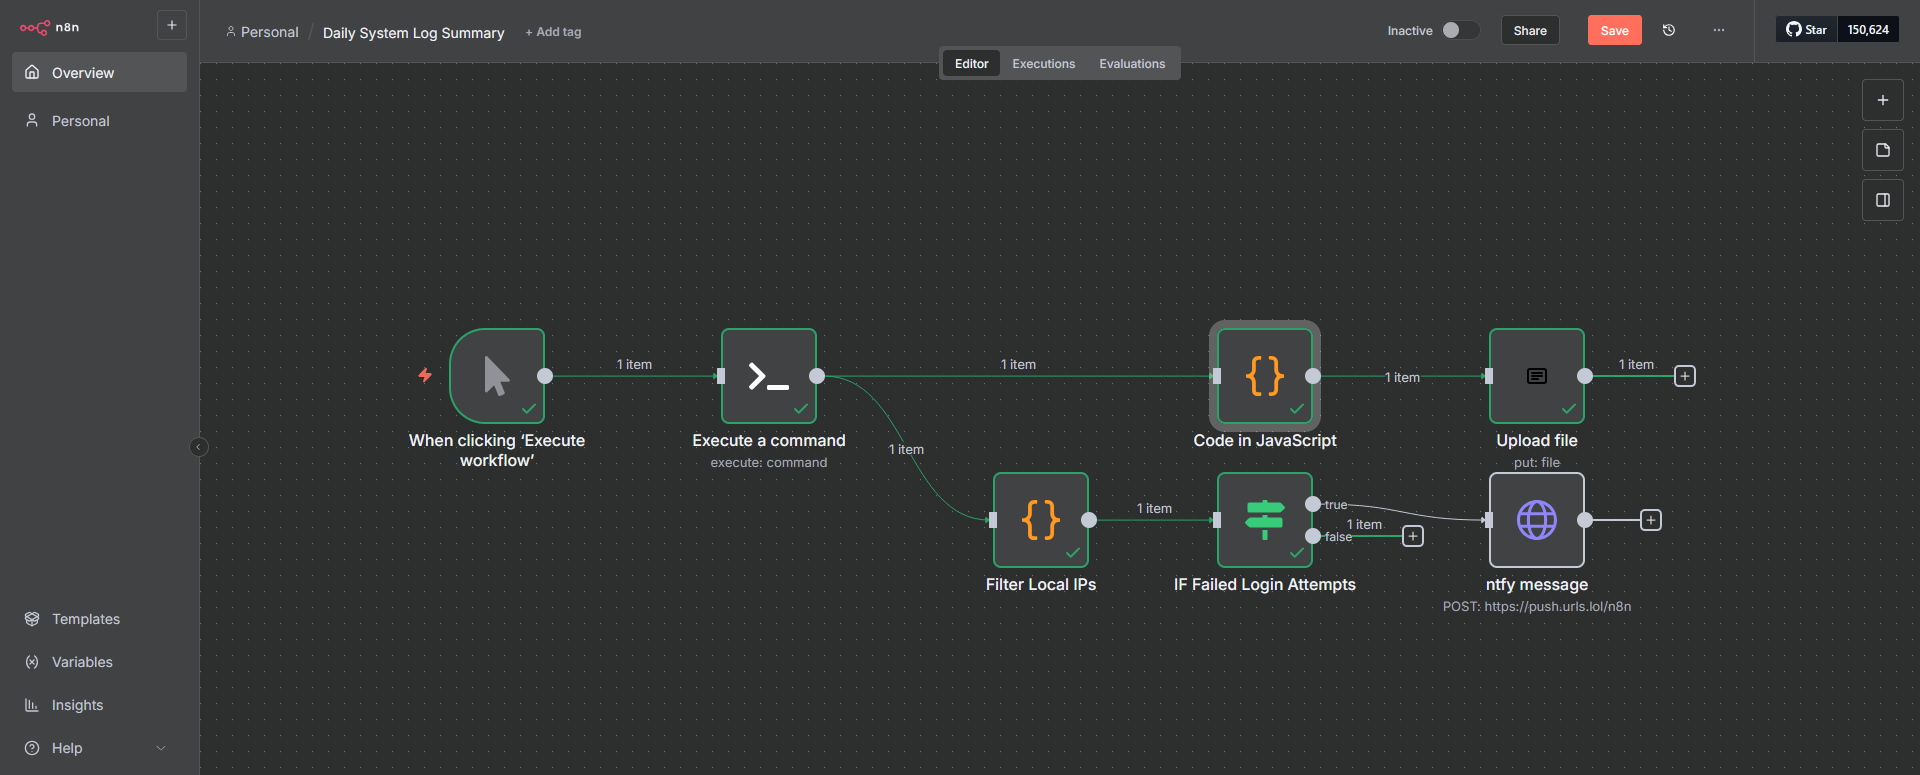
Building the Workflow
I began by pulling live data straight from the system using an Execute Command node. The command collected five core pieces of information:
- System Errors and Warnings – pulled from
journalctlto catch anything marked error, fail, warn, or critical. - Failed SSH Login Attempts – parsed from
/var/log/auth.logusinggrepandawkto count unique IPs. - Successful SSH Logins – showed recent accepted logins with usernames and IPs.
- Kernel Warnings – extracted hardware and system-level messages with
dmesg. - Network Connection Attempts – listed active connections using
ss -tuna.
All of this was wrapped in one compact command and piped into n8n as text output.
( echo "===== System Errors and Warnings ====="; journalctl --system -p 4 -n 300 --no-pager --output=short-iso | grep -E 'error|fail|warn|critical' || echo 'No system issues found'; echo ""; echo "===== Failed SSH Login Attempts ====="; grep "Failed password" /var/log/auth.log | awk '{print $(NF-3)}' | sort | uniq -c | sort -nr | head -10 || echo 'No failed SSH attempts found'; echo ""; echo "===== Successful SSH Logins ====="; grep "Accepted" /var/log/auth.log | tail -10 || echo 'No successful SSH logins found'; echo ""; echo "===== Kernel Warnings ====="; dmesg | grep -iE "error|warn|fail" | tail -10 || echo 'No kernel warnings found'; echo ""; echo "===== Network Connection Attempts ====="; ss -tuna | grep ESTAB | head -10 || echo 'No active network connections found'; ) 2>&1Next came the Function node, which converted that plain-text data into a visual dashboard. The HTML layout included summary tiles at the top with live counts for each section, two-column organization, color-coded categories, and even a copy button for individual system errors.
const now = new Date().toLocaleString("en-US", { timeZone: "America/Detroit" });
const raw = $json.stdout || "No logs found";
// --- Parse Sections ---
const cleaned = raw.replace(/\r/g, "").replace(/\n{2,}/g, "\n");
const regex = /={3,}\s*(.*?)\s*={3,}\n?([\s\S]*?)(?=(?:={3,}|$))/g;
const data = {};
let match;
while ((match = regex.exec(cleaned)) !== null) {
const title = match[1].trim();
const content = match[2].trim().split("\n").filter(l => l.trim());
const filtered = content.filter(l => !/no .*found/i.test(l));
data[title] = filtered.length > 0 ? filtered : [];
}
// --- Render Section ---
function renderSection(title, lines, color) {
const hasData = lines && lines.length > 0;
// Network table
if (title === "Network Connection Attempts") {
if (!hasData)
return `<div class="section wide"><h2>${title}</h2><div class="entry empty">No data found</div></div>`;
const headers = ["NetID", "State", "Recv-Q", "Send-Q", "Local Address:Port", "Peer Address:Port"];
const rows = lines.map(line => {
const cols = line.trim().split(/\s+/).slice(0, 6);
return `<tr>${cols.map((c, i) => `<td data-label="${headers[i] || ""}">${c}</td>`).join("")}</tr>`;
}).join("");
return `
<div class="section wide">
<h2>${title} (${lines.length})</h2>
<div class="table-wrapper">
<table>
<thead><tr>${headers.map(h => `<th>${h}</th>`).join("")}</tr></thead>
<tbody>${rows}</tbody>
</table>
</div>
</div>`;
}
if (!hasData)
return `<div class="section"><h2>${title} (0)</h2><div class="entry empty">No data found</div></div>`;
return `
<div class="section">
<h2>${title} (${lines.length})</h2>
${lines.map((l, i) => {
const safeText = l.replace(/</g, "<");
const id = `${title.replace(/\s+/g, "_")}_${i}`;
const copyBtn =
title === "System Errors and Warnings"
? `<button class="copy-btn" onclick="copyText('${id}')">⧉</button>`
: "";
return `<div class="entry" id="${id}" style="border-left-color:${color}">${safeText}${copyBtn}</div>`;
}).join("")}
</div>`;
}
// --- Colors ---
const colors = {
"System Errors and Warnings": "#ef4444",
"Failed SSH Login Attempts": "#3b82f6",
"Successful SSH Logins": "#22c55e",
"Kernel Warnings": "#f59e0b",
"Network Connection Attempts": "#8b5cf6",
};
// --- Count Summary ---
const counts = {
errors: data["System Errors and Warnings"]?.length || 0,
failedSSH: data["Failed SSH Login Attempts"]?.length || 0,
successSSH: data["Successful SSH Logins"]?.length || 0,
kernel: data["Kernel Warnings"]?.length || 0,
network: data["Network Connection Attempts"]?.length || 0,
};
// --- HTML ---
let html = `
<!DOCTYPE html>
<html lang="en">
<head>
<meta charset="UTF-8">
<title>System Log Dashboard</title>
<link href="https://fonts.googleapis.com/css2?family=Inter:wght@400;500;600&family=Poppins:wght@500;600&display=swap" rel="stylesheet">
<style>
body {
background: #0d0f13;
color: #e5e7eb;
font-family: 'Inter', sans-serif;
padding: 1.5rem;
}
h1 {
font-family: 'Poppins', sans-serif;
font-weight: 600;
font-size: 1.7rem;
margin-bottom: 1rem;
color: #fff;
}
p {
color: #9ca3af;
margin-bottom: 1.5rem;
}
.summary {
display: flex;
gap: 1rem;
flex-wrap: wrap;
margin-bottom: 1.5rem;
}
.card {
flex: 1;
min-width: 140px;
background: rgba(255,255,255,0.04);
border: 1px solid rgba(255,255,255,0.08);
border-radius: 10px;
padding: 1rem;
text-align: center;
box-shadow: 0 2px 6px rgba(0,0,0,0.3);
transition: all 0.2s ease;
}
.card:hover {
background: rgba(255,255,255,0.06);
}
.count {
font-size: 1.4rem;
font-weight: 600;
margin-bottom: 0.3rem;
}
.label {
font-size: 0.85rem;
color: #9ca3af;
}
.errors .count { color: #ef4444; }
.fails .count { color: #3b82f6; }
.success .count { color: #22c55e; }
.kernel .count { color: #f59e0b; }
.network .count { color: #8b5cf6; }
.grid {
display: grid;
grid-template-columns: repeat(2, 1fr);
gap: 1rem;
}
.wide { grid-column: 1 / -1; }
.section {
background: rgba(255,255,255,0.04);
border-radius: 8px;
padding: 1rem;
border: 1px solid rgba(255,255,255,0.07);
}
h2 {
font-family: 'Poppins', sans-serif;
font-size: 1rem;
font-weight: 500;
color: #cbd5e1;
border-bottom: 1px solid rgba(255,255,255,0.05);
margin: 0 0 0.6rem;
padding-bottom: 0.3rem;
}
.entry {
background: rgba(0,0,0,0.25);
margin: 0.25rem 0;
padding: 0.55rem 0.6rem;
border-radius: 6px;
font-size: 0.85rem;
border-left: 3px solid;
white-space: pre-wrap;
position: relative;
}
.entry.empty {
border-left-color: #4b5563;
color: #9ca3af;
font-style: italic;
}
.copy-btn {
position: absolute;
top: 6px;
right: 8px;
background: none;
border: none;
color: #60a5fa;
cursor: pointer;
font-size: 0.8rem;
transition: 0.2s;
}
.copy-btn:hover { color: #93c5fd; }
.table-wrapper { overflow-x: auto; margin-top: 0.4rem; }
table {
width: 100%;
border-collapse: collapse;
font-size: 0.85rem;
}
th, td {
padding: 0.3rem 0.5rem;
border-bottom: 1px solid rgba(255,255,255,0.05);
text-align: left;
}
th {
color: #cbd5e1;
background: rgba(255,255,255,0.05);
font-family: 'Poppins', sans-serif;
}
tr:hover td { background-color: rgba(255,255,255,0.03); }
footer {
color: #9ca3af;
font-size: 0.75rem;
text-align: center;
margin-top: 1.5rem;
border-top: 1px solid rgba(255,255,255,0.05);
padding-top: 0.5rem;
}
@media (max-width: 900px) {
.grid { grid-template-columns: 1fr; }
}
</style>
<script>
function copyText(id) {
const text = document.getElementById(id).innerText.replace('⧉','').trim();
navigator.clipboard.writeText(text).then(() => {
const btn = document.querySelector('#' + id + ' .copy-btn');
if (btn) {
btn.textContent = '✔';
setTimeout(() => (btn.textContent = '⧉'), 1500);
}
});
}
</script>
</head>
<body>
<h1>System Log Dashboard</h1>
<p>Generated: ${now}</p>
<div class="summary">
<div class="card errors"><div class="count">${counts.errors}</div><div class="label">System Errors</div></div>
<div class="card fails"><div class="count">${counts.failedSSH}</div><div class="label">SSH Failures</div></div>
<div class="card success"><div class="count">${counts.successSSH}</div><div class="label">SSH Logins</div></div>
<div class="card kernel"><div class="count">${counts.kernel}</div><div class="label">Kernel Warnings</div></div>
<div class="card network"><div class="count">${counts.network}</div><div class="label">Network Connections</div></div>
</div>
<div class="grid">
${renderSection("System Errors and Warnings", data["System Errors and Warnings"], colors["System Errors and Warnings"])}
${renderSection("Failed SSH Login Attempts", data["Failed SSH Login Attempts"], colors["Failed SSH Login Attempts"])}
${renderSection("Successful SSH Logins", data["Successful SSH Logins"], colors["Successful SSH Logins"])}
${renderSection("Kernel Warnings", data["Kernel Warnings"], colors["Kernel Warnings"])}
${renderSection("Network Connection Attempts", data["Network Connection Attempts"], colors["Network Connection Attempts"])}
</div>
<footer>Generated via n8n • ${now}</footer>
</body>
</html>
`;
return [
{
binary: {
data: await this.helpers.prepareBinaryData(
Buffer.from(html, "utf8"),
"system_log_dashboard.html",
"text/html"
),
},
},
];
Then I introduced a lightweight If node to detect failed SSH login attempts. Using a simple regex check, the workflow looks for numbers under the “Failed SSH Login Attempts” section and triggers a notification only when something new appears. When paired with an Ntfy node, it quietly sends alerts straight to my phone or desktop whenever there’s suspicious activity.

The end result is a practical workflow that not only tracks what’s going on with my system but keeps me informed in real time. You can download the full n8n JSON workflow here.
Final Notes and Thoughts
If you already use n8n for automation, adding a system health dashboard like this is an easy upgrade that gives you real visibility. You can expand it to watch containers, track disk usage, or send scheduled reports automatically.
Sometimes the best tools are the ones you build yourself, piece by piece, and this one does exactly what I need without getting in the way.

And more here


Discussion